Revision History
|
C |
Updated Appendix C&D |
8 March 2024 |
|
B |
Revision based on EPD & AFCD¡¦s comment |
16 November |
|
A |
First Submission |
20 August 2020 |
|
Rev. |
Description of Modification |
Date |
Content
2. Marine Water Quality Monitoring
8 Summary of Monitoring Exceedance, Complaints, Notification of Summons and Prosecutions
10. Conclusion and Recommendations
|
Appendix A |
|
|
Appendix B |
Summary of Implementation Status of Environmental Mitigation |
|
Appendix C |
|
|
Appendix D |
|
|
Appendix E |
|
|
Appendix F |
|
|
Appendix G |
|
|
Appendix H |
|
|
Appendix I |
Executive Summary
A1. The Project, Integrated Waste Management Facility (IWMF), is a Designated Project under the Environmental Impact Assessment Ordinance (Cap. 499) (EIAO) and is currently governed by a Further Environmental Permit (FEP No. FEP-01/429/2012/A) for the construction and operation of the Project.
A2. In accordance with the Updated Environmental Monitoring and Audit (EM&A) Manual for the Project, EM&A works for marine water quality, noise, waste management and ecology should be carried out by Environmental Team (ET), Acuity Sustainability Consulting Limited (ASCL), during the construction phase of the Project.
A3. This is the 8th Quarterly EM&A Report, prepared by ASCL, for the Project summarizing and concluding the monitoring results and audit findings of the EM&A programme at and around Shek Kwu Chau (SKC) during the reporting period from 1 April 2020 to 30 June 2020.
A4. The EM&A works for construction noise, water quality, construction waste, coral, marine mammal and White-Bellied Sea Eagle (WBSE) were conducted during the reporting period in accordance with the Updated EM&A Manual.
A5. Weekly site inspections of the construction works were carried out by ET to audit the mitigation measures implementation status. Monthly joint site inspections were carried out by ET and IEC.
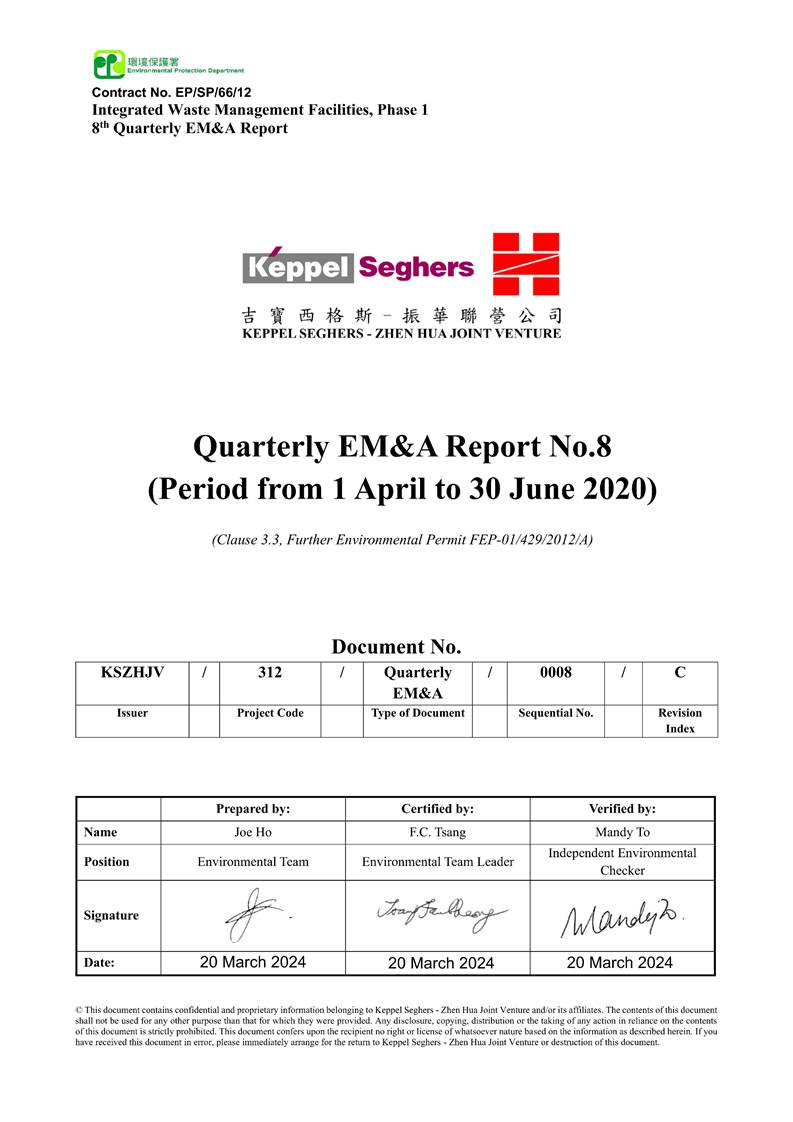
1. Basic Project Information 1.1.1 This is the 8th Quarterly EM&A Report for the Project which summarizes the key findings of the EM&A programme during the reporting period from 1 April 2020 to 30 June 2020. 1.1.2 The Project Organization structure for Construction Phase is presented in Figure 1.1.
|
|
Figure 1.1 Project Organization Chart |
Table 1.1 Contact Details of Key Personnel
|
Party |
Position |
Name |
Telephone no. |
|
Environmental Protection Department |
Project Proponent |
Cheng Tak-Kuen |
2594-6111 |
|
Keppel Seghers ¡V Zhen Hua Joint Venture |
Project Manager |
Kenny Yu |
2192-0606 |
|
Acuity Sustainability Consulting Limited |
Environmental Team Leader |
Jacky Leung |
2698-6833 |
|
ERM-Hong Kong, Limited |
Independent Environmental Checker |
Mandy To |
2271-3000 |
1.3. Summary of Construction Works
1.1.4 Details of the major construction activities undertaken in this reporting period are shown in Table 1.2 below. The construction programme is presented in Appendix A.Table 1.2 Summary of the Construction Activities Undertaken during the Reporting Period
|
Construction activities undertaken |
Remarks on progress |
|
|
Breakwater |
¡P Sand blanket laying
¡P DCM installation |
¡P On-going
¡P On-going |
|
Reclamation area |
¡P Sand blanket laying |
¡P On-going |
|
Seawall portion |
¡P DCM installation
¡P Coring for DCM cluster
¡P Dredging
¡P Cone penetration test
¡P Installation of caisson
¡P Installation of Prefabricated Vertical Drain |
¡P Completed
¡P On-going
¡P 72,156.7042 m3 of dredged sediment in bulk quantity was dumped at relevant dumping site in total up to 30 June 2020.
¡P On-going
¡P On-going
¡P On-going |
|
Portion 8 |
¡P Site trial of sorting facilities |
¡P On-going |
Table 1.3 Summary of Status for Key Environmental Aspects under the Updated EM&A Manual
1.1.6 Other than the EM&A works by ET, environmental briefings, trainings and regular environmental management meetings were conducted, in order to enhance environmental awareness and closely monitor the environmental performance of the contractors. 1.1.7 The EM&A programme has been implemented in accordance with the recommendations presented in the approved EIA Report and the Updated EM&A Manual. A summary of updated implementation status of the environmental mitigation measures for the construction phase of the Project during the reporting period is provided in Appendix B.
2. Marine Water Quality Monitoring 2.1.1 Measurement of Dissolved Oxygen (DO), Turbidity, Suspended Solids (SS), Salinity and pH have been undertaken at the eleven monitoring stations during general water quality monitoring. Besides the above parameters, monitoring of Total Alkalinity, Current Velocity and Current Direction have been undertaken at all fourteen monitoring stations (including S1, S2A and S3) during regular DCM monitoring. 2.1.2 Current velocity and direction, DO, temperature, salinity, turbidity and pH were measured in-situ and the SS, Total Alkalinity were assayed in a HOKLAS laboratory. 2.1.3 In associate with the water quality parameters, other relevant data were also measured, such as monitoring location/position, time, water depth, sampling depth, tidal stages, weather conditions and any special phenomena or work underway nearby were also recorded. 2.1.4 Impact water quality monitoring was conducted 3 days per week in the reporting period. All parameters were monitored during mid-flood and mid-ebb tides at three water depths for general water quality monitoring. The interval between two sets of monitoring has not been less than 36 hours. 2.1.5 Table 2.1 summarizes the monitoring parameters, frequency and duration of the impact water quality monitoring.
Table 2.1 Water Quality Monitoring Parameters, Frequency and Duration
|
Parameter, unit |
Frequency |
No. of Depths |
|
¡P Water Depth(m) ¡P Temperature(oC) ¡P Salinity(ppt) ¡P pH (pH unit) ¡P Dissolved Oxygen (DO)(mg/L and % of saturation) ¡P Turbidity(NTU) ¡P Suspended Solids (SS), mg/L ¡P Total alkalinity (mg/L) ¡P Current velocity (m/s) ¡P Direction (in NESW) |
General water quality monitoring and Regular DCM monitoring: 3 days per week, at mid-flood and mid-ebb tides |
3 water depths: 1m below sea surface, mid-depth and 1m above sea bed. If the water depth is less than 3m, mid-depth sampling only. If water depth is less than 6m, mid-depth may be omitted.
|
2.2 Water Quality Monitoring Locations
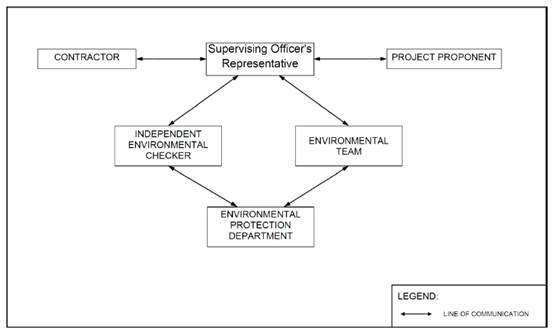
2.2.1 Impact water quality monitoring was conducted at eleven monitoring locations during general water quality monitoring and fourteen water monitoring locations during regular DCM monitoring, as shown in Figure 2.1.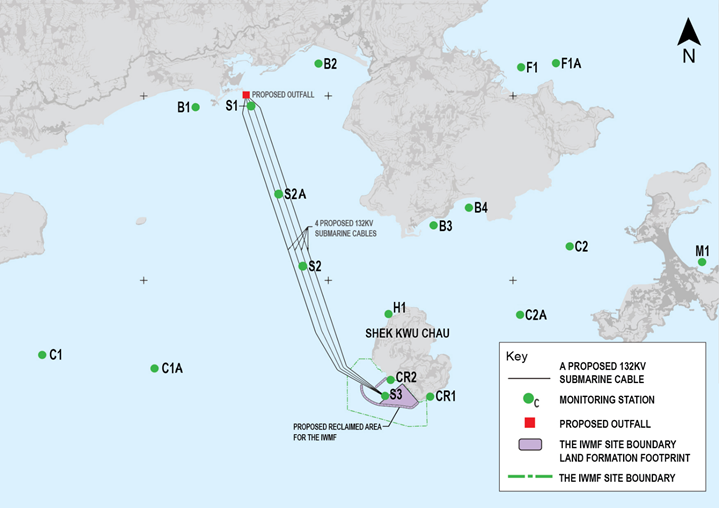
|
Figure 2.1 Water monitoring locations at Artificial Island near SKC |
Table 2.2 Derived Action and Limit Levels for Water Quality Monitoring (Dry Season)
|
Parameters |
Action |
Limit |
|
Construction Phase Impact Monitoring |
||
|
DO in mg/L |
≤ 7.13 |
≤ 4 |
|
SS in mg/L |
≥ 8 or 120% of control station¡¦s SS at the same tide of the same day of measurement, whichever is higher |
≥ 10 or 130% of control station's SS at the same tide of the same day of measurement, whichever is higher |
|
Turbidity in NTU |
≥ 5.6 or 120% of control station¡¦s turbidity at the same tide of the same day of measurement, whichever is higher |
≥ 12.81 or 130% of control station's turbidity at the same tide of the same day of measurement, whichever is higher |
|
Temperature in¢XC |
1.8¢XC above the temperature recorded at representative control station at the same tide of the same day |
2¢XC above the temperature recorded at representative control station at the same tide of the same day |
|
Total Alkalinity in mg/L |
≥116 or 120% of control station¡¦s Total Alkalinity at the same tide of the same day of measurement, whichever is higher |
≥ 118 or 130% of control station¡¦s Total Alkalinity at the same tide of the same day of measurement, whichever is higher |
Notes:
i. "Depth-averaged" is calculated by taking the arithmetic means of reading of all three depths.
ii. For DO, non-compliance of the water quality limits occurs when monitoring result is lower than the limits.
iii. For turbidity, SS and Salinity, non-compliance of the water quality limits occurs when monitoring result is higher than the limits.
Table 2.3 Derived Action and Limit Levels for Water Quality (Wet Season)
|
Parameters |
Action |
Limit |
|
Construction Phase Impact Monitoring |
||
|
DO in mg/L |
≤ 5.28 |
≤ 4 |
|
SS in mg/L |
≥ 12 or 120% of control station¡¦s SS at the same tide of the same day of measurement, whichever is higher |
≥ 14 or 130% of control station's SS at the same tide of the same day of measurement, whichever is higher |
|
Turbidity in NTU |
≥ 4.0 or 120% of control station¡¦s turbidity at the same tide of the same day of measurement, whichever is higher |
≥ 4.3 or 130% of control station's turbidity at the same tide of the same day of measurement, whichever is higher |
|
Temperature in¢XC |
1.8¢XC above the temperature recorded at representative control station at the same tide of the same day |
2¢XC above the temperature recorded at representative control station at the same tide of the same day |
|
Total Alkalinity in mg/L
|
≥ 116 mg/L or 120% of representative control station at the same tide of the same day, whichever is higher |
≥ 118 mg/L or 130% of representative control station at the same tide of the same day, whichever is higher
|
Notes:
i. "Depth-averaged" is calculated by taking the arithmetic means of reading of all three depths.
ii. For DO, non-compliance of the water quality limits occurs when monitoring result is lower than the limits.
iii. For turbidity, SS and Salinity, non-compliance of the water quality limits occurs when monitoring result is higher than the limits.
2.4 Monitoring Results and Observations
2.4.1 DCM injection works and sand blanket laying works were conducted during the reporting period, thus both general water quality monitoring at the eleven monitoring stations and general DCM monitoring including monitoring stations S1, S2A and S3 were conducted. Monitoring results of 7 key parameters: Salinity, DO, turbidity, SS, pH, temperature and total alkalinity in each month of this reporting period, are summarized in Table 2.4, and results trending are presented graphically in Appendix C.
Table 2.4 Summary of Regular DCM Impact Water Quality Monitoring Results
|
Locations |
Parameters |
||||||||||||||||||||||||
|
Salinity (ppt) |
Dissolved Oxygen (mg/L) |
pH |
Turbidity (NTU) |
Suspended Solids (mg/L) |
Temp. (oC) |
Total Alkalinity (mg/L) note ii |
|||||||||||||||||||
|
Surface & Middle |
Bottom |
||||||||||||||||||||||||
|
Apr |
May |
Jun |
Apr |
May |
Jun |
Apr |
May |
Jun |
Apr |
May |
Jun |
Apr |
May |
Jun |
Apr |
May |
Jun |
Apr |
May |
Jun |
Apr |
May |
Jun |
||
|
B1 |
Avg. |
31.14 |
31.78 |
32.02 |
8.26 |
7.81 |
7.70 |
8.23 |
7.81 |
7.73 |
8.45 |
8.38 |
8.39 |
3.1 |
2.9 |
2.8 |
4.03 |
3.65 |
3.72 |
21.7 |
27.4 |
29.8 |
116.6 |
113.2 |
95.0 |
|
Min. |
30.15 |
30.71 |
31.42 |
7.37 |
6.83 |
6.51 |
7.28 |
6.83 |
6.51 |
8.05 |
8.08 |
8.14 |
2.4 |
1.8 |
2.0 |
2.00 |
2.00 |
2.00 |
20.1 |
24.7 |
28.1 |
110.0 |
104.0 |
77.0 |
|
|
Max. |
32.16 |
32.62 |
32.61 |
9.47 |
8.67 |
8.90 |
9.06 |
8.67 |
8.90 |
8.93 |
8.64 |
8.64 |
4.0 |
3.7 |
3.7 |
10.00 |
8.00 |
9.00 |
24.1 |
28.9 |
31.4 |
123.0 |
118.0 |
106.0 |
|
|
B2 |
Avg. |
31.22 |
31.77 |
32.00 |
8.24 |
7.84 |
7.67 |
8.27 |
7.82 |
7.72 |
8.46 |
8.41 |
8.39 |
3.1 |
2.9 |
2.7 |
3.98 |
3.88 |
3.59 |
21.7 |
27.4 |
29.8 |
116.5 |
113.0 |
95.0 |
|
Min. |
30.21 |
30.78 |
31.24 |
7.39 |
6.95 |
6.65 |
7.25 |
6.85 |
6.74 |
8.06 |
8.10 |
8.08 |
2.3 |
1.9 |
2.0 |
2.00 |
2.00 |
2.00 |
20.1 |
24.6 |
28.1 |
110.0 |
105.0 |
77.0 |
|
|
Max. |
32.31 |
32.52 |
32.82 |
8.87 |
8.57 |
8.81 |
9.26 |
8.57 |
8.88 |
8.93 |
8.68 |
8.67 |
4.1 |
3.7 |
3.5 |
10.00 |
9.00 |
8.00 |
24.0 |
28.9 |
31.4 |
123.0 |
118.0 |
106.0 |
|
|
B3 |
Avg. |
31.18 |
31.81 |
32.06 |
8.28 |
7.80 |
7.70 |
8.21 |
7.85 |
7.79 |
8.44 |
8.40 |
8.40 |
3.2 |
3.0 |
2.9 |
4.20 |
4.04 |
3.47 |
21.7 |
27.4 |
29.8 |
116.5 |
113.1 |
94.8 |
|
Min. |
30.21 |
30.70 |
31.43 |
7.56 |
6.95 |
6.55 |
7.42 |
6.75 |
6.59 |
8.05 |
8.05 |
8.06 |
2.4 |
2.0 |
2.1 |
2.00 |
2.00 |
2.00 |
20.1 |
24.6 |
28.1 |
109.0 |
104.0 |
78.0 |
|
|
Max. |
32.27 |
32.59 |
32.81 |
9.38 |
8.62 |
8.64 |
9.27 |
8.58 |
8.76 |
8.93 |
8.65 |
8.68 |
4.2 |
3.7 |
3.7 |
11.00 |
10.00 |
7.00 |
24.1 |
28.7 |
31.5 |
123.0 |
118.0 |
104.0 |
|
|
B4 |
Avg. |
31.22 |
31.78 |
32.02 |
8.32 |
7.78 |
7.73 |
8.31 |
7.72 |
7.77 |
8.45 |
8.38 |
8.37 |
3.2 |
3.0 |
2.9 |
4.43 |
4.08 |
3.74 |
21.7 |
27.4 |
29.8 |
116.3 |
113.1 |
94.8 |
|
Min. |
30.10 |
30.78 |
31.31 |
7.30 |
6.87 |
6.58 |
7.60 |
6.86 |
6.65 |
8.08 |
8.09 |
8.12 |
2.4 |
1.9 |
2.1 |
2.00 |
2.00 |
2.00 |
20.2 |
24.5 |
28.2 |
110.0 |
104.0 |
77.0 |
|
|
Max. |
32.30 |
32.61 |
32.66 |
9.54 |
8.66 |
8.52 |
9.24 |
8.49 |
8.89 |
8.91 |
8.69 |
8.68 |
4.2 |
3.8 |
3.9 |
11.00 |
10.00 |
8.00 |
23.9 |
28.7 |
31.3 |
123.0 |
118.0 |
103.0 |
|
|
C1A
|
Avg. |
31.22 |
31.77 |
32.05 |
8.22 |
7.81 |
7.74 |
8.25 |
7.77 |
7.74 |
8.43 |
8.39 |
8.37 |
3.1 |
2.8 |
2.7 |
4.41 |
4.64 |
3.96 |
21.6 |
27.3 |
29.7 |
116.5 |
113.0 |
94.8 |
|
Min. |
30.11 |
30.62 |
31.41 |
7.25 |
6.78 |
6.50 |
7.54 |
6.75 |
6.62 |
8.09 |
8.05 |
8.10 |
2.3 |
1.8 |
2.0 |
2.00 |
2.00 |
2.00 |
20.1 |
24.5 |
28.1 |
110.0 |
104.0 |
77.0 |
|
|
Max. |
32.31 |
32.60 |
32.88 |
9.56 |
8.61 |
8.77 |
9.52 |
8.64 |
8.71 |
8.94 |
8.69 |
8.64 |
4.1 |
3.6 |
3.7 |
9.00 |
9.00 |
8.00 |
23.9 |
28.7 |
31.4 |
123.0 |
118.0 |
104.0 |
|
|
C2A |
Avg. |
31.22 |
31.79 |
32.02 |
8.25 |
7.83 |
7.70 |
8.28 |
7.76 |
7.77 |
8.45 |
8.38 |
8.38 |
3.1 |
2.8 |
2.7 |
4.49 |
4.62 |
4.06 |
21.7 |
27.3 |
29.8 |
116.6 |
113.1 |
94.5 |
|
Min. |
30.14 |
30.81 |
31.25 |
7.28 |
6.76 |
6.52 |
7.22 |
6.89 |
6.57 |
8.06 |
8.06 |
8.12 |
2.4 |
1.8 |
2.0 |
2.00 |
2.00 |
2.00 |
20.1 |
24.7 |
28.1 |
110.0 |
104.0 |
77.0 |
|
|
Max. |
32.30 |
32.63 |
32.85 |
9.41 |
8.62 |
8.76 |
9.07 |
8.62 |
8.84 |
8.92 |
8.66 |
8.68 |
4.1 |
3.7 |
3.6 |
9.00 |
10.00 |
8.00 |
23.9 |
28.6 |
31.3 |
123.0 |
118.0 |
103.0 |
|
|
CR1 |
Avg. |
31.19 |
31.81 |
32.00 |
8.31 |
7.78 |
7.72 |
8.27 |
7.81 |
7.70 |
8.46 |
8.39 |
8.38 |
3.1 |
2.8 |
2.7 |
4.40 |
4.55 |
3.75 |
21.6 |
27.3 |
29.7 |
116.6 |
113.2 |
95.2 |
|
Min. |
30.15 |
30.84 |
31.35 |
7.46 |
6.93 |
6.72 |
7.31 |
6.89 |
6.58 |
8.05 |
8.10 |
8.01 |
2.4 |
1.9 |
2.0 |
2.00 |
2.00 |
2.00 |
20.1 |
24.5 |
28.1 |
109.0 |
104.0 |
77.0 |
|
|
Max. |
32.23 |
32.62 |
32.77 |
9.57 |
8.60 |
8.87 |
9.46 |
8.69 |
8.57 |
8.94 |
8.68 |
8.66 |
4.1 |
3.7 |
3.5 |
10.00 |
13.00 |
8.00 |
23.9 |
28.9 |
31.5 |
124.0 |
118.0 |
103.0 |
|
|
CR2 |
Avg. |
31.21 |
31.78 |
32.01 |
8.27 |
7.82 |
7.72 |
8.31 |
7.93 |
7.76 |
8.43 |
8.39 |
8.37 |
3.1 |
2.8 |
2.7 |
4.48 |
4.28 |
3.66 |
21.6 |
27.3 |
29.7 |
116.6 |
113.1 |
95.1 |
|
Min. |
30.10 |
30.55 |
31.30 |
7.25 |
6.86 |
6.57 |
7.34 |
6.83 |
6.75 |
8.11 |
8.05 |
8.07 |
2.3 |
2.0 |
2.1 |
2.00 |
2.00 |
2.00 |
20.1 |
24.5 |
28.1 |
109.0 |
103.0 |
76.0 |
|
|
Max. |
32.32 |
32.60 |
32.80 |
9.52 |
8.57 |
8.87 |
9.51 |
8.69 |
8.91 |
8.94 |
8.68 |
8.68 |
4.0 |
3.7 |
3.5 |
10.00 |
11.00 |
8.00 |
24.0 |
29.0 |
31.4 |
124.0 |
118.0 |
104.0 |
|
|
F1A |
Avg. |
31.19 |
31.78 |
32.02 |
8.25 |
7.77 |
7.73 |
8.24 |
7.71 |
7.72 |
8.45 |
8.40 |
8.38 |
3.1 |
2.8 |
2.7 |
4.68 |
5.06 |
4.13 |
21.6 |
27.4 |
29.8 |
116.7 |
113.0 |
94.8 |
|
Min. |
30.10 |
30.72 |
31.29 |
7.22 |
6.76 |
6.73 |
7.30 |
6.93 |
6.49 |
8.06 |
8.02 |
8.01 |
2.4 |
1.9 |
2.0 |
2.00 |
2.00 |
2.00 |
20.1 |
24.6 |
28.1 |
109.0 |
104.0 |
78.0 |
|
|
Max. |
32.32 |
32.63 |
32.84 |
9.45 |
8.70 |
8.91 |
9.12 |
8.42 |
8.86 |
8.86 |
8.68 |
8.65 |
4.0 |
3.7 |
3.6 |
10.00 |
12.00 |
9.00 |
23.9 |
28.7 |
31.3 |
124.0 |
118.0 |
103.0 |
|
|
H1 |
Avg. |
31.19 |
31.80 |
32.04 |
8.23 |
7.77 |
7.69 |
8.29 |
7.82 |
7.70 |
8.44 |
8.37 |
8.38 |
3.1 |
2.9 |
2.7 |
4.72 |
4.32 |
4.04 |
21.6 |
27.3 |
29.8 |
116.4 |
113.1 |
94.7 |
|
Min. |
30.10 |
30.70 |
31.34 |
7.27 |
6.91 |
6.55 |
7.54 |
6.94 |
6.65 |
8.06 |
8.05 |
8.06 |
2.3 |
1.8 |
1.9 |
2.00 |
2.00 |
2.00 |
20.1 |
24.4 |
28.1 |
109.0 |
104.0 |
77.0 |
|
|
Max. |
32.28 |
32.63 |
32.80 |
9.55 |
8.66 |
8.88 |
9.53 |
8.67 |
8.85 |
8.94 |
8.68 |
8.67 |
4.1 |
3.7 |
3.6 |
11.00 |
11.00 |
9.00 |
24.1 |
28.6 |
31.3 |
124.0 |
119.0 |
103.0 |
|
|
M1 |
Avg. |
31.21 |
31.80 |
32.00 |
8.26 |
7.80 |
7.72 |
8.25 |
7.79 |
7.72 |
8.45 |
8.39 |
8.38 |
3.1 |
2.8 |
2.7 |
4.42 |
4.67 |
3.99 |
21.6 |
27.3 |
29.7 |
116.7 |
113.0 |
95.2 |
|
Min. |
30.16 |
30.73 |
31.21 |
7.31 |
6.85 |
6.57 |
7.38 |
6.85 |
6.56 |
8.11 |
8.04 |
8.06 |
2.3 |
1.9 |
2.0 |
2.00 |
2.00 |
2.00 |
20.1 |
24.5 |
28.1 |
109.0 |
104.0 |
77.0 |
|
|
Max. |
32.27 |
32.62 |
32.87 |
9.54 |
8.62 |
8.89 |
9.21 |
8.47 |
8.88 |
8.91 |
8.69 |
8.67 |
4.1 |
3.6 |
3.6 |
11.00 |
13.00 |
8.00 |
23.9 |
28.5 |
31.3 |
124.0 |
118.0 |
103.0 |
|
|
S1 |
Avg. |
31.21 |
31.82 |
32.06 |
8.30 |
7.77 |
7.76 |
8.26 |
7.67 |
7.76 |
8.46 |
8.40 |
8.38 |
3.1 |
2.9 |
2.7 |
4.69 |
4.54 |
4.06 |
21.7 |
27.5 |
29.8 |
116.4 |
113.2 |
94.9 |
|
Min. |
30.11 |
30.77 |
31.43 |
7.37 |
6.83 |
6.61 |
7.34 |
6.82 |
6.69 |
8.05 |
8.05 |
8.08 |
2.3 |
1.8 |
2.0 |
2.00 |
2.00 |
2.00 |
20.1 |
24.5 |
28.1 |
110.0 |
104.0 |
78.0 |
|
|
Max. |
32.19 |
32.63 |
32.77 |
9.22 |
8.63 |
8.86 |
9.61 |
8.43 |
8.84 |
8.91 |
8.68 |
8.60 |
4.2 |
3.7 |
3.7 |
11.00 |
15.00 |
9.00 |
24.1 |
29.0 |
31.3 |
124.0 |
118.0 |
104.0 |
|
|
S2A |
Avg. |
31.20 |
31.80 |
32.02 |
8.25 |
7.77 |
7.73 |
8.30 |
7.76 |
7.72 |
8.44 |
8.40 |
8.38 |
3.1 |
2.8 |
2.7 |
4.56 |
4.91 |
4.14 |
21.7 |
27.4 |
29.8 |
116.5 |
113.1 |
95.0 |
|
Min. |
30.13 |
30.70 |
31.28 |
7.30 |
6.86 |
6.82 |
7.30 |
6.84 |
6.73 |
8.08 |
8.09 |
8.06 |
2.3 |
1.9 |
2.0 |
2.00 |
2.00 |
2.00 |
20.1 |
24.6 |
28.1 |
109.0 |
104.0 |
78.0 |
|
|
Max. |
32.35 |
32.58 |
32.85 |
9.35 |
8.66 |
8.65 |
9.12 |
8.69 |
8.86 |
8.94 |
8.66 |
8.68 |
3.9 |
3.6 |
3.6 |
9.00 |
20.00 |
9.00 |
24.1 |
28.9 |
31.3 |
124.0 |
118.0 |
104.0 |
|
|
S3 |
Avg. |
31.23 |
31.82 |
32.03 |
8.23 |
7.78 |
7.71 |
8.29 |
7.81 |
7.73 |
8.45 |
8.40 |
8.39 |
3.2 |
2.9 |
2.7 |
4.60 |
4.63 |
3.96 |
21.6 |
27.3 |
29.7 |
116.7 |
113.2 |
95.0 |
|
Min. |
30.13 |
30.74 |
31.20 |
7.27 |
6.86 |
6.58 |
7.18 |
6.89 |
6.52 |
8.10 |
8.06 |
8.04 |
2.4 |
1.9 |
2.1 |
2.00 |
2.00 |
2.00 |
20.1 |
24.5 |
28.1 |
110.0 |
105.0 |
78.0 |
|
|
Max. |
32.23 |
32.57 |
32.77 |
9.31 |
8.57 |
8.74 |
9.38 |
8.60 |
8.90 |
8.93 |
8.67 |
8.64 |
4.1 |
3.8 |
3.9 |
10.00 |
17.00 |
8.00 |
24.0 |
28.9 |
31.4 |
124.0 |
118.0 |
103.0 |
|
Notes:
i. "Avg", ¡§Min¡¨ and ¡§Max¡¨ is the average, minimum and maximum respectively of the data from measurements conducted under mid-flood and mid-ebb tides at three water depths, except that of DO where the data for ¡§Surface & Middle¡¨ and ¡§Bottom¡¨ are calculated separately.
ii. Total alkalinity test is only conducted on DCM working day with reference to master programme in Appendix A.
iii. Monitoring at S1, S2A and S3 shall only be conducted during DCM work period referring to master programme in Appendix A.
3. Noise Monitoring
3.1 Noise Monitoring Parameters
3.1.1 Impact noise monitoring was conducted weekly in the reporting period between 0700-1900 hours on normal weekdays. Additional impact noise monitoring was conducted weekly in the reporting period between 1900-0700 hours on all days as well as public holidays and Sundays. 3.1.2 Construction noise level measured in terms of the A-weighted equivalent continuous sound pressure level (LAeq). Leq 30min was used as the monitoring parameter for the time period between 0700 and 1900 hours on normal weekdays. Leq 5mins was used as the monitoring parameter for the time period between 1900 and 0700 hours as well as public holidays and Sundays. Table 3.1 summarizes the monitoring parameters, frequency and duration of the impact noise monitoring and additional impact noise monitoring.Table 3.1 Noise Monitoring Parameters, Time, Frequency and Duration
|
Monitoring Station |
Time |
Duration |
Parameters |
|
M1/ N_S1, M2/ N_S2, M3/ N_S3 |
Day time: 0700-1900 hrs (during normal weekdays) |
Once per week Leq 5min/Leq 30min (average of 6 consecutive Leq 5min) |
Leq, L10 & L90 |
|
Evening time: 1900-2300 hrs (including normal weekdays, also public holidays and Sundays) |
Once per week Leq 5min (3 sets of Leq 5min) |
Leq, L10 & L90 |
|
|
Night time: 2300-0700 hrs (including normal weekdays, also public holidays and Sundays) |
Once per week Leq 5min (3 sets of Leq 5min) |
Leq, L10 & L90 |
|
|
Alternative location (MA) |
Day time: 0700-1900 hrs (during normal weekdays) |
Once per week until further notification Leq 5min/Leq 30min (average of 6 consecutive Leq 5min) |
Leq, L10 & L90 |
|
Evening time: 1900-2300 hrs (including normal weekdays, also public holidays and Sundays) |
Once per week until further notification Leq 5min (3 sets of Leq 5min) |
Leq, L10 & L90 |
|
|
Night time: 2300-0700 hrs (including normal weekdays, also public holidays and Sundays) |
Once per week until further notification Leq 5min (3 sets of Leq 5min) |
Leq, L10 & L90 |
3.2 Noise Monitoring Locations
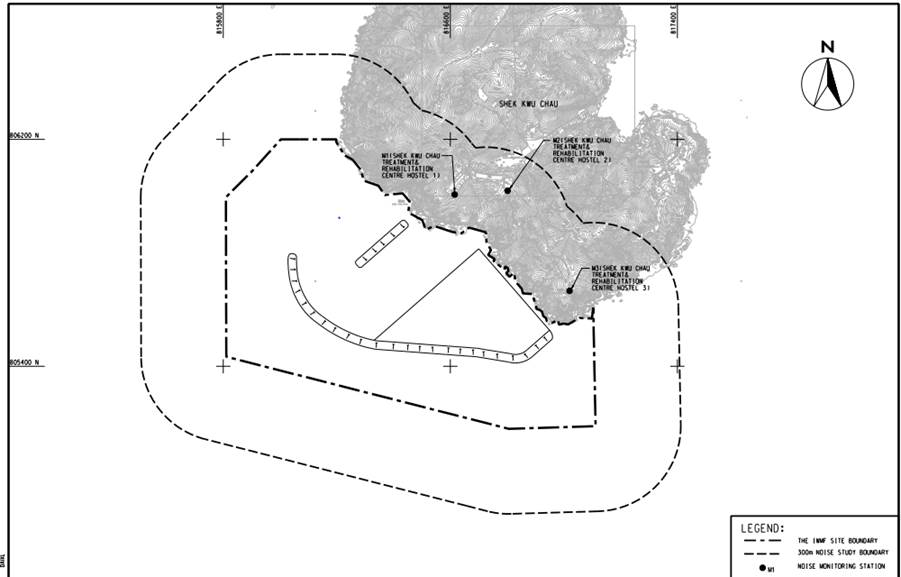
3.2.1 Three noise monitoring locations for impact monitoring and additional impact monitoring at the nearby sensitive receivers are shown in Figure 3.1
|
|
Figure 3.1 Noise monitoring locations at SKC |
Table 3.2 Noise Monitoring Location
|
Station |
NSR ID in EIA Report |
Noise Monitoring Location |
Type of sensitive receiver(s) |
Measurement Type |
|
M1* |
N_S1 |
Shek Kwu Chau Treatment & Rehabilitation Centre Hostel 1 |
Residential |
Façade |
|
M2* |
N_S2 |
Shek Kwu Chau Treatment & Rehabilitation Centre Hostel 2 |
Residential |
Façade |
|
M3* |
N_S3 |
Shek Kwu Chau Treatment & Rehabilitation Centre Hostel 3 |
Residential |
Façade |
|
MA |
- |
The farthest barge outside the site boundary with no construction works subject to site condition |
- |
Free field |
Figure 3.2 Proposed alternative noise monitoring location at barge FTB-17 at Shek Kwu Chau
3.3 Action and Limit Levels
3.3.1 The Action/Limit Levels in line with the criteria of Practice Note for Professional Persons (ProPECC PN 2/93) ¡§Noise from Construction Activities ¡V Non-statutory Controls¡¨ and Technical Memorandum on Environmental Impact Assessment Process issued by HKSAR Environmental Protection Department [¡§EPD¡¨] under the Environmental Impact Assessment Ordinance, Cap 499, S.16 is presented in Table 3.3.Table 3.3 Action and Limit Levels for Noise per Updated EM&A Manual
|
Time Period |
Action |
Limit (dB(A)) |
|
0700-1900 hrs on normal weekdays |
When one documented complaint is received |
75 dB(A) |
3.4 Monitoring Results and Observations
3.4.1 Impact monitoring for noise impact for daytime was conducted in the reporting period. The impact noise levels at Noise Monitoring Stations at SKC (i.e. M1/ N_S1 to M3/ N_S3) and alternative monitoring location (i.e. MA) are summarized in Table 3.5. Additional impact monitoring during restricted hours was conducted in the reporting period. The additional impact noise levels at Noise Monitoring Stations at SKC (i.e. M1/ N_S1 to M3/ N_S3) and alternative monitoring location (i.e. MA) are summarized in Table 3.6 and Table 3.7 respectively. Trending of the noise monitoring results is presented graphically in Appendix D. 3.4.2 Major construction activity, major noise source and extreme weather which might affect the results were recorded during the impact monitoring. 3.4.3 According to our field observations, the major noise source identified at the designated noise monitoring station in the reporting month are summarised in Table 3.4. No noticeable noise source was found near the monitoring station M1, M2 & M3 and sound of sea waves was found near the monitoring station MA.Table 3.4 Summary of Field Observation
|
Monitoring Station |
Major Noise Source |
|
M1 |
Nil |
|
M2 |
Nil |
|
M3 |
Nil |
|
MA |
Sound of sea waves |
3.4.4 No data from impact monitoring during daytime has exceeded the stipulated limit level at 75 dB(A).
Table 3.5 Summary of Impact Noise Monitoring Results during Daytime (0700 ¡V 1900 hrs)
|
Location |
Noise in dB(A) |
||||||||
|
Range of Leq 30min |
Range of L10 5min |
Range of L90 5min |
|||||||
|
Apr |
May |
Jun |
Apr |
May |
Jun |
Apr |
May |
Jun |
|
|
M1 |
- |
- |
57.2 ¡V 67.4 |
- |
- |
62.1 ¡V 70.6 |
- |
- |
54.1 ¡V 63.0 |
|
M2 |
- |
- |
59.0 ¡V 68.0 |
- |
- |
59.3 ¡V 71.6 |
- |
- |
55.5 ¡V 64.3 |
|
M3 |
- |
- |
59.4 ¡V 70.2 |
- |
- |
64.0 ¡V 74.8 |
- |
- |
55.6 ¡V 67.7 |
|
MA |
64.9 ¡V 70.8 |
68.8 ¡V 71.2 |
- |
67.2 ¡V 73.6 |
71.1 ¡V 73.2 |
- |
61.4 ¡V 64.6 |
65.5 ¡V 68.1 |
|
3.4.5 Applicable mitigation measures for construction works are fully implemented as shown in Appendix B, where double-glazed windows and air conditioning system were also installed and confirmed operable for the NSRs (N_S1, N_S2 & N_S3).
3.4.6 During the noise monitoring event, frontline staff of ET have inquired the treatment centre users on any noise disturbance from the construction activities at evening and night time, where no complaint and adverse opinions was received.
3.4.7 Data from impact monitoring during evening time and night time were compared with the NCO criteria. Where site inspection and auditing on Contractor¡¦s record have shown that the conditions stipulated in the Construction Noise Permit (CNP) issued by the Noise Control Authority for construction works during restricted hours were followed. No inappropriate practice were spotted during evening time and night time construction works, thus the stipulated requirement on noise impact control during night time and evening time was achieved.
Table 3.6 Summary of the Additional Impact Noise Monitoring Results during Evening Time (1900-2300 hrs)
|
Location |
Noise in dB(A) |
||||||||
|
Range of Leq 5min |
Range of L10 5min |
Range of L90 5min |
|||||||
|
Apr |
May |
Jun |
Apr |
May |
Jun |
Apr |
May |
Jun |
|
|
M1 |
- |
- |
55.2 ¡V 61.7 |
- |
- |
57.5 ¡V 68.5 |
- |
- |
52.3 ¡V 58.9 |
|
M2 |
- |
- |
55.7 ¡V 61.9 |
- |
- |
58.2 ¡V 67.0 |
- |
- |
51.1 ¡V 58.4 |
|
M3 |
- |
- |
54.5 ¡V 62.8 |
- |
- |
58.1 ¡V 67.6 |
- |
- |
51.3 ¡V 58.0 |
|
MA |
59.0 ¡V 64.8 |
58.3 ¡V 68.0 |
- |
60.0 ¡V 67.7 |
64.5 ¡V 71.7 |
- |
52.3 ¡V 61.6 |
56.1 ¡V 64.7 |
- |
Table 3.7 Summary of Additional Impact Noise Monitoring Results during Night Time (2300 ¡V 0700 hrs)
|
Location |
Noise in dB(A) |
||||||||
|
Range of Leq 5min |
Range of L10 5min |
Range of L90 5min |
|||||||
|
Apr |
May |
Jun |
Apr |
May |
Jun |
Apr |
May |
Jun |
|
|
M1 |
- |
- |
54.3 ¡V 60.4 |
- |
- |
58.4 ¡V 66.8 |
- |
- |
51.5 ¡V 57.9 |
|
M2 |
- |
- |
52.1 ¡V 65.0 |
- |
- |
57.0 ¡V 69.0 |
- |
- |
47.1 ¡V 62.2 |
|
M3 |
- |
- |
55.1 ¡V 62.0 |
- |
- |
57.9 ¡V 66.6 |
- |
- |
49.8 ¡V 59.6 |
|
MA |
57.7 ¡V 59.9 |
59.3 ¡V 66.2 |
- |
59.0 ¡V 60.9 |
64.6 ¡V 71.1 |
- |
56.2 ¡V 58.7 |
57.5 ¡V 64.3 |
- |
4.1 The waste generated from this Project includes inert construction and demolition (C&D) materials, and non-inert C&D materials. Non-inert C&D materials are made up of general refuse, vegetative wastes and recyclable wastes such as plastics and paper/cardboard packaging waste. Steel materials generated from the project are also grouped into non-inert C&D materials as the materials were not disposed of with other inert C&D materials.
4.2 As advised by the Contractor, for C&D waste, no metals were generated and collected by registered recycling collector. 0 tonnes of paper was generated on site and collected by registered recycling collector. No plastic waste was collected by registered recycling collector. 0 L of chemical waste was collected by licensed chemical waste collector. 45.5 m3 of other types of wastes (e.g. general refuse) were generated on site and disposed of at Landfill. 60,411.5 m3 of fill sand and 62,859.5 m3 of fill rock were imported during the reporting period.
4.3 5,277.82 m3 of dredged sediment in bulk quantity was dumped according to its dumping permit (EP/MD/20-125) during the reporting period.
4.4 Chemical waste generated from the cleaning of oil stain and leakage on deck of barges was stored in the chemical waste storage area on the barges.
4.5 With reference to relevant handling records and trip tickets of this Project, the quantities of different types of waste generated in the reporting period are summarised in Table 4.1. Details of cumulative waste management data are presented as a waste flow table in Appendix E.
Table 4.1 Quantities of Waste Generated from the Project
|
Reporting Month |
Actual Quantities of Inert C&D Materials Generated Monthly |
Actual Quantities of C&D Wastes Generated Monthly |
||||||||||||
|
Total Quantity Generated |
Hard Rock and Large Broken Concrete (see Note 1) |
Reused in the Contract |
Reused in other Projects |
Disposed as Public Fill |
Imported Fill |
Metals |
Paper / cardboard packaging |
Plastics (see Note 2) |
Chemical Waste |
Others, e.g. general refuse (see Note 3) |
||||
|
Sand |
Public Fill |
Rock |
||||||||||||
|
(in ,000m3) |
(in ,000m3) |
(in ,000m3) |
(in ,000m3) |
(in ,000m3) |
(in ,000m3) |
(in ,000kg) |
(in ,000kg) |
(in ,000kg) |
(in ,000kg) |
(in ,000L) |
(in ,000m3) |
|||
|
Apr 2020 |
0 |
0 |
0 |
0 |
0 |
12.78 |
0 |
10.1825 |
0 |
0 |
0 |
0 |
0 |
0.0195 |
|
May 2020 |
0 |
0 |
0 |
0 |
0 |
16.1138 |
0 |
24.374 |
0 |
0 |
0 |
0 |
0 |
0.0195 |
|
Jun 2020 |
0 |
0 |
0 |
0 |
0 |
31.5177 |
0 |
28.303 |
0 |
0 |
0 |
0 |
0 |
0.0065 |
Notes:
1. Broken concrete for recycling into aggregates.
2. Plastic refer to plastic bottles / containers, plastic sheets / foam from packaging materials.
3. Use the conversion factor: 1 full load of dumping truck being equivalent to 6.5 m3 by volume.
4.6 Although there is not much waste generation in the reporting period from the Project, the Contractor is reminded to sort and store any solid and liquid waste on-site properly prior to disposal.
5.1 Coral Monitoring Parameters
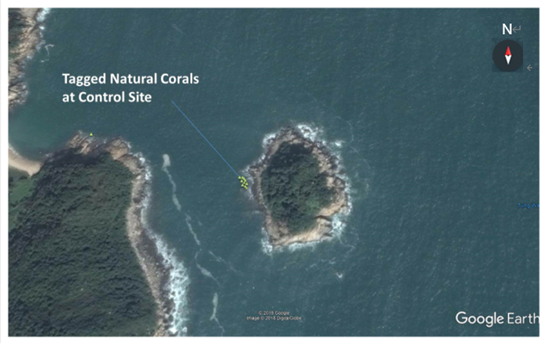
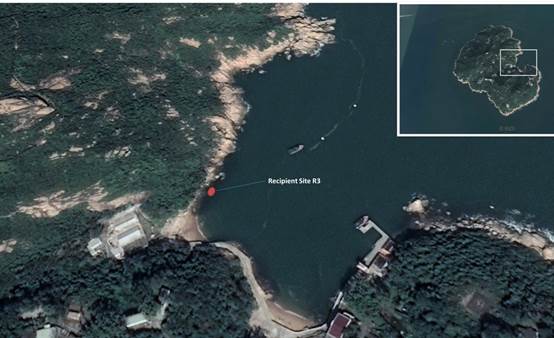
5.1.1 Ten (10) tagged coral colonies at each site of suggested control site and indirect impact site are being monitored weekly for the first month and followed by monthly monitoring for three months. The selected Control Site is located at Yuen Kong Chau of Soko Islands about 7 km away from the project area. After the hitting of super typhoon Mangkhut in mid-September 2018, the coral re-tagging activities at indirect impact site and control site were conducted in November and December 2018 respectively. Tagged coral colonies at the proposed recipient site are being monitored quarterly for one year and the last post-translocation coral monitoring was completed on 28 Mar 2019. The selected recipient site R3 is located the opposite side of the Project area at about 2 km away. 5.1.2 Monitoring recorded the following parameters (using the same methodology adopted during the pre-translocation survey); the size, presence, health conditions (percentage of mortality/bleaching) and percentage of sediment of each trans-located coral colony. The general environmental conditions including weather, sea, and tidal conditions of survey sites were monitored. 5.1.3 Health status of coral was assessed by the following criteria:Hard coral: Percentage of surface area exhibiting partial mortality and blanched/bleached area of each coral colony and degree of sedimentation.
5.2 Coral Monitoring Locations
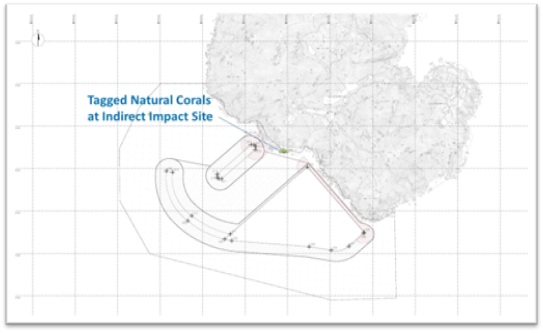
Location of the ten tagged coral colonies at each of the proposed indirect impact site, control site, the recipient site R3 and REA transect at proposed indirect impact site are shown in Figure 5.1, Figure 5.2 and Figure 5.3 respectively:|
|
|
Figure 5.1 Tagged Natural Corals at Indirect Impact Site Near SKC for re-tagging after typhoon Mangkhut |
|
|
|
Figure 5.2 Tagged Natural Corals at Control Site Near Yuen Kong Chau for re-tagging after typhoon Mangkhut |
|
|
|
Figure 5.3 Tagged Translocation Corals at Recipient Site R3 near SKC |
Table 5.1 Tagged Natural Corals during Baseline and Re-tagged Natural Corals after Typhoon Manghkut at Control Site near Yuen Long Chau
|
Coral # note i |
GPS Coordinates |
|
|
1 |
N22¢X09¡¦45.96¡¨ |
E113¢X54¡¦57.81¡¨ |
|
2R |
N22¢X11¡¦29.12¡¨ |
E113¢X59¡¦09.01¡¨ |
|
3 |
N22¢X09¡¦45.81¡¨ |
E113¢X54¡¦57.78¡¨ |
|
4 |
N22¢X09¡¦45.70¡¨ |
E113¢X54¡¦57.95¡¨ |
|
5R |
N22¢X11¡¦29.10¡¨ |
E113¢X59¡¦09.18¡¨ |
|
6 |
N22¢X09¡¦45.75¡¨ |
E113¢X54¡¦58.02¡¨ |
|
7R |
N22¢X11¡¦29.17¡¨ |
E113¢X59¡¦08.86¡¨ |
|
7 |
N22¢X09¡¦45.65¡¨ |
E113¢X54¡¦57.94¡¨ |
|
8 |
N22¢X09¡¦45.53¡¨ |
E113¢X54¡¦57.90¡¨ |
|
9 |
N22¢X09¡¦46.23¡¨ |
E113¢X54¡¦54.70¡¨ |
|
10R |
N22¢X11¡¦29.18¡¨ |
E113¢X59¡¦08.91¡¨ |
Notes:
i. The re-tagged corals were marked as ##R.
Table 5.2 Re-tagged Natural Corals after Typhoon Manghkut at Indirect Impact Site near SKC
|
Coral # note i |
GPS Coordinates |
|
|
11R |
N22¢X11¡¦29.14¡¨ |
E113¢X59¡¦08.92¡¨ |
|
12R |
N22¢X11¡¦29.12¡¨ |
E113¢X59¡¦09.01¡¨ |
|
13R |
N22¢X11¡¦29.11¡¨ |
E113¢X59¡¦09.07¡¨ |
|
14R |
N22¢X11¡¦29.13¡¨ |
E113¢X59¡¦09.12¡¨ |
|
15R |
N22¢X11¡¦29.10¡¨ |
E113¢X59¡¦09.18¡¨ |
|
16R |
N22¢X11¡¦29.07¡¨ |
E113¢X59¡¦09.23¡¨ |
|
17R |
N22¢X11¡¦29.17¡¨ |
E113¢X59¡¦08.86¡¨ |
|
18R |
N22¢X11¡¦29.14¡¨ |
E113¢X59¡¦08.94¡¨ |
|
19R |
N22¢X11¡¦29.20¡¨ |
E113¢X59¡¦08.81¡¨ |
|
20R |
N22¢X11¡¦29.18¡¨ |
E113¢X59¡¦08.91¡¨ |
Notes:
i. The re-tagged corals were marked as ##R.
Table 5.3 GPS Coordinates of Recipient Site R3
|
Site |
GPS Coordinates |
|
|
R3 |
N22¢X11¡¦43.69¡¨ |
E113¢X28.99¡¨ |
5.3 Action and Limit Levels
5.3.1 Monitoring result was reviewed and compared against the below Action Level and Limit Level (AL/LL) as set with the below Table 5.4 and Table 5.5.
Table 5.4 Action and Limit Levels for Construction Phase Coral Monitoring
|
Parameter |
Action Level |
Limit Level |
|
Mortality |
If during Impact Monitoring a 15% increase in the percentage of partial mortality on the corals occurs at more than 20% of the tagged indirect impact site coral colonies that is not recorded on the tagged corals at the control site, then the Action Level is exceeded. |
If during Impact Monitoring a 25% increase in the percentage of partial mortality on the corals occurs at more than 20% of the tagged indirect impact site coral colonies that is not recorded on the tagged corals at the control site, then the Limit Level is exceeded. |
Table 5.5 Action and Limit Levels for Post-Translocation Coral Monitoring
|
Parameter |
Action Level |
Limit Level |
|
Mortality |
If during Post-Translocation Monitoring a 15% increase in the percentage of partial mortality on the corals occurs at more than 20% of the translocated coral colonies that is not recorded on the original corals in the recipient site, then the Action Level is exceeded. |
If during Post-Translocation Monitoring a 25% increase in the percentage of partial mortality on the corals occurs at more than 20% of the translocated coral colonies that is not recorded on the original corals in the recipient site, then the Limit Level is exceeded. |
5.4 Monitoring Results and Observations
5.4.1 Ten (10) hard coral colonies were monitored at each site of Control and Indirect Impact sites as suggested in the Construction Phase Monitoring Plan. The general health conditions (size, mortality, bleaching and sediment) were recorded and summarized in Table 5.7 and Table 5.8. Photos of each tagged coral colonies were taken during the monitoring activities and shown in Appendix F. 5.4.2 The 6th quarterly coral monitoring during construction phase at both Indirect Impact Site and Control Site was conducted on 26 Jun 2020 and the weather condition was summarized in Table 5.6.Table 5.6 Weather Condition for the 6th Quarterly Coral Monitoring during Construction Phase at both Indirect Impact Site and Control Site
|
Date |
Condition |
Average Underwater Visibility |
|
26 Jun 2020 |
- Southwest wind force 4 - Sunny period |
Less than 0.5m |
Table 5.7 Sizes, Condition, Mortality, Bleaching and Sediment of 10 Natural Coral Colonies at Control Site of 6th Quarterly Coral Monitoring (26 Jun 2020) during 22nd to 24th Months Construction Phase Monitoring
|
Coral # |
Species |
Size (cm) ¡V Max. Diameter |
Condition |
Mortality (%) |
Bleaching (%) |
Sediment (%) |
|||
|
Baseline (26 Jun 2018 & 3 Dec 2018) |
26 Jun 2020 |
Baseline (26 Jun 2018 & 3 Dec 2018) |
26 Jun 2020 |
Baseline (26 Jun 2018 & 3 Dec 2018) |
26 Jun 2020 |
||||
|
1 |
Goniopora stutchburyi |
25 |
Fair |
0 |
0 |
0 |
0 |
0 |
0 |
|
2R |
Goniopora stutchburyi |
10 |
Good |
0 |
0 |
0 |
0 |
0 |
0 |
|
3 |
Psammocora superficialis |
18 |
Fair |
0 |
0 |
0 |
0 |
0 |
0 |
|
4 |
Turbinaria peltata |
13 |
Good |
0 |
0 |
0 |
0 |
0 |
0 |
|
5R |
Goniopora stutchburyi |
18 |
Good |
0 |
0 |
0 |
0 |
0 |
0 |
|
6 |
Cyphastrea serailia |
43 |
Fair |
0 |
0 |
0 |
0 |
0 |
0 |
|
7R |
Coscinaraea sp. |
15 |
Good |
0 |
0 |
0 |
0 |
0 |
0 |
|
8 |
Goniopora stutchburyi |
21 |
Good |
0 |
0 |
0 |
0 |
0 |
0 |
|
9 |
Goniopora stutchburyi |
11 |
Fair |
0 |
0 |
0 |
0 |
0 |
0 |
|
10R |
Goniopora stutchburyi |
20 |
Good |
0 |
0 |
0 |
0 |
0 |
0 |
Notes:
i. The re-tagged corals were marked as ##R.
Table 5.8 Sizes, Condition, Mortality, Bleaching and Sediment of 10 Natural Coral Colonies at Indirect Impact Site of 6th Quarterly Coral Monitoring (26 Jun 2020) during 22nd to 24th Months Construction Phase Monitoring
|
Coral # |
Species |
Size (cm) ¡V Max. Diameter |
Condition |
Mortality (%) |
Bleaching (%) |
Sediment (%) |
|||
|
Baseline (23 Nov 2018) |
26 Jun 2020 |
Baseline (23 Nov 2018) |
26 Jun 2020 |
Baseline (23 Nov 2018) |
26 Jun 2020 |
||||
|
11R |
Cyphastrea serailia |
48 |
Good |
0 |
0 |
0 |
0 |
0 |
0 |
|
12R |
Favites chinensis |
27 |
Good |
0 |
0 |
0 |
0 |
0 |
0 |
|
13R |
Turbinaria peltata |
21 |
Good |
0 |
0 |
0 |
0 |
0 |
0 |
|
14R |
Favites chinensis |
8 |
Good |
0 |
0 |
0 |
0 |
0 |
0 |
|
15R |
Goniopora stutchburyi |
11 |
Good |
0 |
0 |
0 |
0 |
0 |
0 |
|
16R |
Psammocora superficialis |
27 |
Good |
0 |
0 |
0 |
0 |
0 |
0 |
|
17R |
Favites chinensis |
15 |
Good |
0 |
0 |
0 |
0 |
0 |
0 |
|
18R |
Psammocora superficialis |
39 |
Good |
0 |
0 |
0 |
0 |
0 |
0 |
|
19R |
Psammocora superficialis |
42 |
Good |
0 |
0 |
0 |
0 |
0 |
0 |
|
20R |
Psammocora superficialis |
29 |
Good |
0 |
0 |
0 |
0 |
0 |
0 |
Notes:
i. The re-tagged corals were marked as ##R.
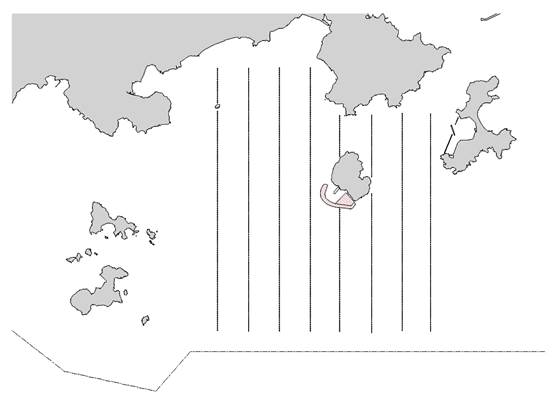
For the vessel-based marine mammal surveys, the monitoring team adopted the standard line-transect method (Buckland et al. 2001) as same as that adopted during the EIA study and pre-construction phase monitoring to allow fair comparison of marine mammal monitoring results.
Eight transect lines are set at Southeast Lantau survey area, including Shek Kwu Chau, waters between Shek Kwu Chau and the Soko Islands, inshore waters of Lantau Island (e.g. Pui O Wan) as well as southwest corner of Cheung Chau as shown in Figure 6.1 below:
|
|
Figure 6.1 Line Transects for Marine Mammal Surveys |
In comparison to the baseline monitoring results, results from the analyzed construction phase monitoring data would allow the detection of any changes of their usage of habitat, in response to the scheduled construction works.
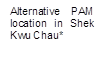
6.1.2 Passive Acoustic Monitoring (PAM)The PAM aims to study the usage of an area by Finless Porpoise by using an array of automated static porpoise detectors (e.g. C-POD) which would be deployed at different locations to detect the unique ultra-high frequency sounds produced by Finless Porpoise. During the construction period, the PAM survey will be conducted including placement of two passive porpoise detectors outside the Project Area as control site (i.e. within Pui O Wan and to the south of Tai A Chau) and one porpoise detector within the Project Area (i.e. near Shek Kwu Chau) as shown in Figure 6.2 below.
|
|||||||||||||||||||||||
Table 6.1 PAM Deployment Period
|
Season |
Months |
Deployment Period |
|
Peak Season |
December, January, February, March, April or May |
At least 30 days during the peak months of porpoise occurrence in South Lantau waters |
6.1.2.1 The automated static porpoise detectors shall detect the presence and number of finless porpoise and Chinese White Dolphins respectively over the deployment period, with the false signal such as boat sonar and sediment transport noise distinguished and filtered out. The detectors shall be deployed and retrieved by professional dive team on the seabed of the three selected location shown in Figure 6.2. During each deployment, the C-POD unit serial numbers as well as the time and date of deployments shall be recorded. Information including the GPS positions and water depth at each of the deployment locations shall also be obtained.
6.1.2.2 The diel patterns (i.e. 24-hour activity pattern) of finless porpoise occurrence among the three sites at Shek Kwu Chau, Tai A Chau and Pui O Wan shall be analyzed. Peaks and troughs of finless porpoise occurrence per hour of day would be identified and compared with the results obtained from pre-construction monitoring.
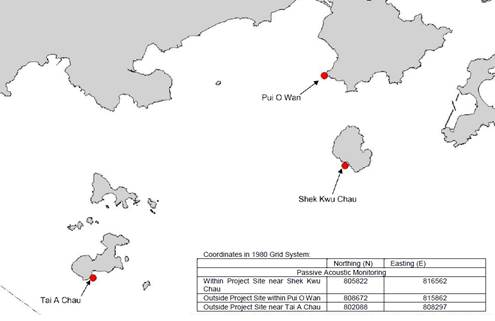
6.1.3 Land-based Theodolite TrackingThe Land-based Theodolite Tracking study would use the same station as in the AFCD monitoring study(same as the baseline monitoring location), which is situated at the southwest side of Shek Kwu Chau (GPS position: 22o11.47¡¦ N and 113o59.33¡¦ E) as shown in below Figure 6.3. The station was selected based on its height above sea level (at least 20 metres), close proximity to shore, and relatively unobstructed views of the entire Project Area to the southwest of Shek Kwu Chau. The height of the Shek Kwu Chau Station established by the HKCRP team is 74.6 m high at mean low water, and only a few hundred metres to the IWMF reclamation site, which is ideal for the purpose for the present behavioural and movement monitoring of finless porpoises as well during construction phase considering there as an un-obstructed vantage point at a height above the Project Site.
|
|
Figure 6.3 Locations of Land-based Theodolite Tracking |
6.1.3.1 During the construction phase, Land-based Theodolite Tracking will be carried out for approximately six hours of tracking for each day of field work for a period listed as Table 6.2 below, preferably at the initial stage of the construction period (i.e. December 2018 to May 2019).
Table 6.2 Land-based Theodolite Tracking Survey Period
|
Season |
Months |
Survey Period |
|
Peak Season |
December, January, February, March, April or May |
30 days during the peak months of porpoise occurrence in South Lantau waters |
6.1.3.2 The monitoring period for land-based theodolite tracking will be proposed to be overlapped with the PAM. The monitoring team consists of one experienced theodolite operator and at least two field observers for assistance. To conduct theodolite tracking, the observers will search systematically for Finless Porpoise using the unaided eye and 7 x 50 handheld binoculars on each survey day throughout the study area. When an individual or group of porpoises is located, a theodolite tracking session will be initiated and focal follow methods will be used to track the porpoise(s). Behavioural state data (i.e. resting, milling, travelling, feeding and socializing) shall also be recorded every 5 minutes for the focal individual or group. Positions of porpoises and boats shall be measured using a digital theodolite connected to a laptop computer. This tracking survey will be conducted during the peak season between December 2018 and May 2019 for 30 surveys spanning across 15-16 weeks during the peak season to provide good temporal coverage during the initial stage of the construction period.
6.2 Specific Mitigation Measures
6.2.1 Monitored exclusion zonesDuring the installation/re-installation/relocation process of floating type silt curtains, in order to avoid the accidental entrance and entrapment of marine mammals within the silt curtains, a monitored exclusion zone of 250 m radius from silt curtain should be implemented and monitored by competent Marine Mammal Observers (MMOs). Marine Mammal Exclusion Zone (MMEZ) would also be implemented for precautionary purpose for DCM works.
6.2.2 Marine mammal watching planUpon the completion of silt curtain installation/re-installation/relocation, marine mammal watching plan would be implemented to observe the presence of any marine mammal around the localized silt curtain or being trapped by the localized silt curtain.
6.3 Results and Observations
6.3.1 Vessel-based Line-transect Survey6.3.1.1 Five monthly surveys were conducted during the reporting period. As this is covering designated peak season (December ¡V May) and non-peak season (June ¡V November), two survey were completed in April and May 2020 separately while one survey was completed in June 2020. A total on effort (transects only) survey length of 202.6 km was completed, 167.1 km at Beaufort Sea State 2 or better (Table 6.3). Twenty sightings were recorded during the reporting period (Table 6.4).
Table 6.3 Summary of Vessel-based Line-transect Survey Effort
|
Date |
Area* |
Beaufort |
Effort (km) |
Season |
Vessel |
Effort Type** |
|
16 Apr 2020 |
SEL |
1 |
30.0 |
SPRING |
SMRUHK |
P |
|
2 |
10.8 |
|||||
|
28 Apr 2020 |
SEL |
1 |
1.8 |
SPRING |
SMRUHK |
P |
|
2 |
3.0 |
|||||
|
3 |
13.5 |
|||||
|
4 |
22.0 |
|||||
|
16 May 2020 |
SEL |
1 |
29.7 |
SPRING |
SMRUHK |
P |
|
2 |
10.9 |
|||||
|
27 May 2020 |
SEL |
1 |
40.5 |
SPRING |
SMRUHK |
P |
|
2 |
0.7 |
|||||
|
29 Jun 2020 |
SEL |
0 |
1.1 |
SUMMER |
SMRUHK |
P |
|
1 |
36.8 |
|||||
|
2 |
1.8 |
* As shown in Figure. 6.1
** P (from AFCD) denotes the ON EFFORT survey on the transect line, not the adjoining passages
Table 6.4 Sightings recorded during Apr to Jun 2020 Vessel-based Line-transect Survey
|
Date |
Species |
Sighting No. |
Time |
Group Size |
PSD |
Behaviour |
Lat. |
Long. |
Area |
Effort |
Season |
|
16 Apr 2020 |
Finless Porpoise |
51 |
10:31 |
2 |
50 |
Travelling |
22.1737 |
1144.0027 |
SEL |
ON |
SPRING |
|
Finless Porpoise |
52 |
10:40 |
5 |
77 |
Travelling |
22.1806 |
114.0033 |
SEL |
ON |
SPRING |
|
|
Finless Porpoise |
53 |
11:12 |
1 |
N/A |
Unknown |
22.1937 |
113.9962 |
SEL |
OPP |
SPRING |
|
|
Finless Porpoise |
54 |
11:15 |
1 |
72 |
Unknown |
22.1851 |
113.9935 |
SEL |
ON |
SPRING |
|
|
Finless Porpoise |
55 |
11:22 |
5 |
15 |
Surface Active |
22.1817 |
113.9937 |
SEL |
ON |
SPRING |
|
|
Finless Porpoise |
56 |
11:46 |
6 |
0 |
Multiple |
22.1753 |
113.9835 |
SEL |
ON |
SPRING |
|
|
Finless Porpoise |
57 |
12:31 |
4 |
10 |
Unknown |
22.1860 |
113.9733 |
SEL |
ON |
SPRING |
|
|
Finless Porpoise |
58 |
12:34 |
1 |
79 |
Unknown |
22.1788 |
113.9735 |
SEL |
ON |
SPRING |
|
|
Finless Porpoise |
59 |
12:47 |
9 |
132 |
Surface Active |
22.1751 |
113.9635 |
SEL |
ON |
SPRING |
|
|
Finless Porpoise |
60 |
12:57 |
5 |
72 |
Surface Active |
22.1841 |
113.9637 |
SEL |
ON |
SPRING |
|
|
Finless Porpoise |
61 |
13:41 |
3 |
N/A |
Travelling |
22.1863 |
113.9536 |
SEL |
OPP |
SPRING |
|
|
Finless Porpoise |
62 |
13:50 |
1 |
79 |
Travelling |
22.1830 |
113.9536 |
SEL |
ON |
SPRING |
|
|
Finless Porpoise |
63 |
14:04 |
11 |
79 |
Surface Active |
22.1744 |
113.9446 |
SEL |
ON |
SPRING |
|
|
Finless Porpoise |
64 |
14:20 |
5 |
48 |
Others |
22.1837 |
113.9443 |
SEL |
ON |
SPRING |
|
|
28 Apr 2020 |
Finless Porpoise |
65 |
10:14 |
5 |
0 |
Travelling |
22.1768 |
114.0123 |
SEL |
ON |
SPRING |
|
27 May 2020 |
Finless Porpoise |
66 |
10:42 |
2 |
106 |
Unknown |
22.18491 |
113.9440 |
SEL |
ON |
SPRING |
|
Finless Porpoise |
67 |
11:11 |
2 |
90 |
Travelling |
22.19779 |
113.9541 |
SEL |
ON |
SPRING |
|
|
Finless Porpoise |
68 |
11:24 |
2 |
27 |
Travelling |
22.18595 |
113.9542 |
SEL |
ON |
SPRING |
|
|
Finless Porpoise |
69 |
13:26 |
2 |
154 |
Others |
22.17851 |
114.003 |
SEL |
ON |
SPRING |
|
|
29 June 2020 |
Chinese White Dolphin |
70 |
10:56 |
1 |
146 |
Feeding |
22.2134 |
113.9638 |
SEL |
ON |
SUMMER |
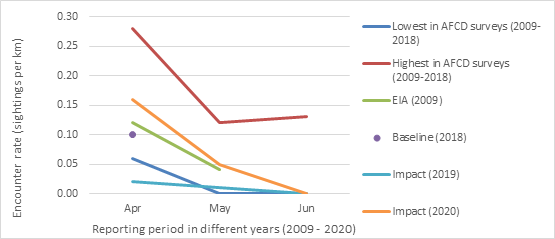
Figure 6.4 Plot
of encounter rate during April to June in 2009 ¡V 2020 from different
surveys
6.3.1.2 A review of the long term AFCD marine mammal monitoring programme, the EIA and the pre-construction baseline monitoring report for this project was conducted. Both the EIA and the pre-construction baseline monitoring were conducted during the peak porpoise months Dec 2008 to May 2009 and Feb to April 2018, respectively. The AFCD long term monitoring data, EIA data, baseline monitoring in 2018 and impact monitoring in 2019 should be compared directly to Impact Survey results of the reporting periods.
6.3.1.3 A review of the Beaufort Sea state survey conditions between 2009 and 2018 (only data available from AFCD at time of writing; (AFCD 2018; 2017; 2016; 2015; 2014; 2013; 2012; 2011; 2010)) shows that survey conditions in April to June 2020 were within the % limits of previous AFCD surveys, similar to impact monitoring surveys conducted in 2019.
6.3.1.4 A review of all the porpoise sightings in the survey area for April to June between 2009-2018 indicates that there is more sightings usually recorded in April to June. Given the similar survey conditions and the encounter rate recorded for porpoise in the project area during the reporting period, the encounter rate for April to June 2020 was 0.16, 0.05, 0.00 km-1 respectively (see Figure 6.4), it is noted that the encounter rate of impact survey is similar when compared to other years. It is noted that the reporting period was covering peak and non-peak season and that works at IWMF are increasing, both which may impact encounter rates. It is also noted that the impact survey focuses on a relatively small populations of highly mobile individuals and the survey area conducted for this monitoring is very small. For April to June 2020, as was similar to the case in 2019 impact monitoring conducted by ET and the encounter rates of impact surveys were lying within the range of encounter rate in AFCD surveys.
6.3.1.5 Data and records of the implemented mitigation measures, including construction vessel routing and speed control, marine mammal watching plan and avoidance of noisy work during the peak season, are collected form the Contractor and now under detail review. As surveys continue for this project, data shall be constantly re-evaluated across survey months to discern trends and impacts, if any.
6.3.2 PAM and Land-based Theodolite Tracking6.3.2.1 30 days of PAM surveys were started at 1 May 2019 and completed until the end of May 2019. Multiple PAM systems were deployed at three sites. The PAM system located at the IWMF was lost, however, an alternative data set has been identified. The PAM systems at the two control sites Tai A Chau and Pui O were recovered on 3 August 2019. A summary of marine mammal detections shows that porpoise were recorded every day of deployment at each site, but at varying frequencies. The detailed theodolite result was presented in 17th Monthly EM&A report (November 2019) while detailed PAM result was presented in 18th Monthly EM&A report (December 2019).
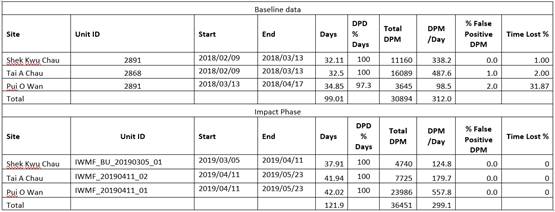
6.3.2.2 For the baseline study, the DPM for each site was 11,160 (Shek Kwu Chau), 16,089 (Tai A Chau) and 3645 (Pui O Wan), totalling 30,894 DPM across all three sites, compared to DPMs of 4740 (Shek Kwu Chau), 7725 (Tai A Chau) and 23,986 (Pui O Wan), totalling 36,451 DPM, for the impact phase study. As the impact phase study was longer than the baseline study, it is not appropriate to directly compare total counts of DPM, however, the DPM rate (the average number of detections per day) for each site can be more directly compared. During the baseline study, Shek Kwu Chau averaged 338.2 DPM per day compared to 124.8 DPM per day, during the impact phase study. This showed a decrease in the daily average of porpoise detection at Shek Kwu Chau. During the baseline study, Tai A Chau averaged 487.6 DPM per day compared to 179.7 DPM per day, during the impact phase study. This showed a decrease in the daily average of porpoise detection at Tai A Chau. During the baseline study, Pui O Wan averaged 98.5 DPM per day compared to 557.8 DPM per day, during the impact phase study. This showed a significant increase in the daily average of porpoise detections at Pui O Wan (Table 6.5).
6.3.2.3 Overall, the PAM study showed that porpoise continue to consistently utilise the Shek Kwu Chau habitat immediately adjacent to the IWMF construction activities, although to a lesser degree than that prior to construction activities. In addition, the Pui O Wan site, which is 2.5 km away from the IWMF construction area, was also consistently utilised during the impact phase PAM study. A continued assessment of fine scale habitat use, particularly through PAM which yields large quantities of data, would allow a more comprehensive assessment of the EIA predictions.
Table 6.5 Summary Statistic Comparison of Baseline (2018) and Impact Phase (2019) Passive Acoustic Monitoring
6.3.2.4 Theodolite surveys were completed in May 2019. In total, thirty four days of theodolite tracking were completed between February - May 2019, comprising 167 hours and 49 minutes of observation. No Chinese white dolphin was observed and only one finless was recorded. The finless porpoise encounter rate was calculated as 0.006 finless porpoise per hour, in all weather conditions.
6.3.2.5 A total of 2620 vessels of ten different types were observed and tracked within or in the proximity of the IWMF construction site. These comprised fishing boats (236), speed boats (29), container boats (155), government boats (22), high speed ferries (53), others (13) and IWMF-Related construction platforms (974), tug boats(240), transportation boats (363), construction boats (531 and approximately 8 buoys were present marking the site boundary. The detailed Land-based Theodolite Tracking Report was presented in 5th Quarterly EM&A report and 17th Monthly EM&A report.
6.3.2.6 The baseline theodolite tracking was conducted immediately prior to and during the site preparation activities of the site. The baseline data records a decrease in porpoise sightings as site preparation activities commenced and notes that the decrease was most likely due to the onset of site preparation activities. The impact theodolite tracking conducted for this study records a marked increase in the number of Project related vessels and platforms and, in agreement with baseline conclusions, shows a concomitant decrease in finless porpoise sightings.
6.3.2.7 Photo records of the marine mammal monitoring taken during the reporting period are presented in Appendix G.
6.3.3 Specific Mitigation Measures
7. White-Bellied Sea Eagle
7.1 WBSE Monitoring Parameters
7.1.1 The objective of the construction phase monitoring should be to verify the utilisation of the area by WBSE, their responses to construction disturbance, as well as the effectiveness of the proposed mitigation measures. Throughout the construction phase, field surveys should be conducted twice per month during their core breeding season (from December to May), and once per month outside their core breeding season (from June to November). The monitoring frequency should be increased to weekly during the incubation period of each year. In order to confirm their foraging ground near the construction site, it is necessary to conduct daily monitoring during the first week of nestling period in each year. 7.1.2 Since the location of the WBSE nest was located at the southwest of SKC within the hillside shrubland, it is impossible to observe the eggs during incubation period. Therefore, monitoring with increased frequency during incubation period could not be carried out. Daily monitoring will be carried out once any chick is recorded during the monitoring day.7.2.1 Five monitoring for monthly construction phase were conducted during the reporting period. Since there is no landing point along the western part of SKC, boat survey was used for the monitoring survey. In order to increase the chance of finding the WBSEs, monitoring survey was carried out either early in the morning or later in the afternoon. The weather conditions of monitoring survey were shown in Table 7.1.
Table 7.1 Weather Conditions during the WBSE Monitoring (Monthly)
|
Date |
Condition |
Temperature (¢J) |
|
17 April 2020 |
- East wind force 4 - Sunny |
28 |
|
30 April 2020 |
- Southwest wind force 4 to 5 - Sunny |
29 |
|
15 May 2020 |
- South wind force 3 to 4 - Sunny |
29 |
|
29 May 2020 |
- Southwest wind force 3 - Sunny |
30 |
|
26 June 2020 |
- South wind force 4 - Sunny |
31 |
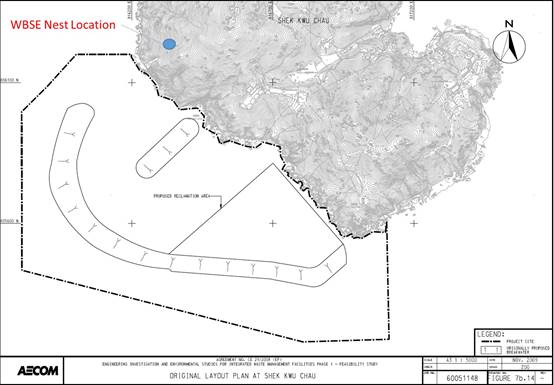
Figure 7.1 Location of WBSE Nest on SKC
7.2.5 No invasion of other fauna species was recorded and no sign of using the construction site as a foraging ground was recorded as well. 7.2.6 During the reporting period, no abnormal behaviour of the recorded adults was shown. All marine works during 22nd to 24th month construction period (i.e. April 2020 to June 2020) did not show any influence on the WBSE. 7.2.7 Photo records of the WBSE taken during the reporting period are presented in Appendix H.
8.1 No exceedance of the Action and Limit Levels of the regular construction noise, coral and WBSE monitoring was recorded during the reporting period.
8.2 For general & regular DCM water monitoring, two (2) of the water quality monitoring results for Suspended Solid (SS) recorded during the reporting period had exceeded the relevant Action Level and one (1) of them had exceeded the relevant Limit Level. None of the water quality monitoring results for SS reported had exceeded the Action and Limit Level during April 2020, two (2) & one (1) of the water quality monitoring results for SS reported had exceeded the Action & Limit Level during May 2020 respectively and none of the water quality monitoring results for SS reported had exceeded the Action & Limit Level during June 2020.
8.3 Investigations carried out immediately for each of the exceedance cases during the reporting period had shown that these exceedances were unrelated to the Project, however, environmental deficiencies of the Contractor on the implementation of silt curtain deployment system were spotted.
8.4 Further investigation was made with the Contractor on the silt curtain design and checking procedure as stated in the deposited Silt Curtain Deployment Plan. Rectification actions regarding to the improper implementation of silt curtain system shall be carried out immediately.
8.5 The Contractor has been reminded that all measures recommended in the deposited Silt Curtain Deployment Plan shall be fully and properly implemented for the Project as per Clause 2.6A of the FEP.
8.6 No notification of summons and prosecution was received in the reporting period.
8.7 Statistics on complaints, notifications of summons and successful prosecutions are summarized in Appendix I.
9. EM&A Site Inspection
9.1 Site inspections were carried out on a weekly basis to monitor the implementation of proper environmental pollution control and mitigation measures under the Contract. Site inspections were carried out at the Site Portions 1, 1A & 1B during the reporting period. Portions 1, 1A & 1B were the sites near SKC within the Site boundary.
9.2 Joint site inspection with IEC was carried out on a monthly basis.
9.3 Minor deficiencies were observed during weekly site inspection. Key observations during the site inspections are summarized below:
¡P Site tidiness were not maintained properly
¡P Prevention actions for oil/chemical spillage were not carried out properly
¡P Chemical waste was not stored properly
¡P Good housekeeping practice were not well-maintained
¡P Soil was accumulated on the edge of the barge
¡P General rubbish should only be disposed of designated area
¡P Dark smoke was observed from the exhaust of engine
9.4 The Contractor had rectified all of the observations identified during environmental site inspections in the reporting period.
9.5 According to the EIA Study Report, Environmental Permit, contract documents and Updated EM&A Manual, the mitigation measures detailed in the documents, except the silt curtain system, are implemented as much as practical during the reporting period. An updated Implementation Status of Environmental Mitigation Measures (EMIS) is provided in Appendix B.
10. Conclusion and Recommendations
10.1 This 8th Quarterly Environmental Monitoring and Audit (EM&A) Report summarizes the EM&A works undertaken during the period from 1 April 2020 to 30 June 2020 in accordance with the Updated EM&A Manual and the requirement under EP- 429/2012/A and FEP-01/429/2012/A.
10.2 Construction noise, water quality, construction waste, coral, marine mammal and White-Bellied Sea Eagle (WBSE) monitoring were carried out in the reporting period. No project-related exceedance of the Action and Limit Level was recorded during the reporting period, however, environmental deficiencies of the Contractor on the implementation of silt curtain deployment system were spotted.
10.3 Weekly environmental site inspections were conducted during the reporting period. Environmental deficiencies were observed during site inspection and were rectified.
10.5 According to the field observation by MMO during the reporting period, temporary silt plume floating was observed at close proximity of the outside of silt curtains, moving out from the sand laying working area. The Contractor has ceased the malpractice and no silt plume was observed at the working area within 30 minutes upon discovery. The Contractor is reminded to ensure the proper implementation of mitigation measures as specified in the Updated EM&A Manual and Silt Curtain Deployment Plan.
10.6 Regarding to the deployment of silt curtains as a principal water quality impact mitigation measures on various marine works, the Contractor has been reminded to follow strictly to the design and checking procedure as specified in the Silt Curtain Deployment Plan. The Contractor has been reminded to pay extra attention on the status of deployed silt curtain. The Contractor is reminded that all measures recommended in the deposited silt curtain deployment plan shall be fully and properly implemented for the Project as per EP condition 2.6 of the FEP.
10.7 As dredging works was conducted in the reporting month, the Contractor had been reminded to follow strictly to the design and checking procedure as specified in the Silt Curtain Deployment Plan for the dredging works. The Contractor had been reminded to follow the regulation on rate and means for dredging works as stipulated in FEP Clause 2.17 ¡V 2.21 or the approved Supporting Document for Reviewing Dredging Rate and Filling Rate, whichever is applicable. The Contractor is reminded to follow Dumping At Sea Ordinance (DASO) for the storage, handling and disposal of dredged materials.
10.8 No environmental complaint was received in the reporting period.
10.9 No notification of summons or prosecution was received since commencement of the Contract.
10.10 The ET will keep track on the construction works to confirm compliance of environmental requirements and the proper implementation of all necessary mitigation measures.