Revision History
|
Rev. |
Description of Modification |
Date |
|
A |
First Submission |
14 November 2025 |
Contents
2. Marine Water Quality Monitoring
8. Summary of Monitoring Exceedance, Complaints, Notification of Summons and Prosecutions
11. Conclusion and Recommendations
Appendix A |
|
|
Appendix B |
Summary of Implementation Status of Environmental Mitigation |
|
Appendix C |
|
|
Appendix D |
|
|
Appendix E |
|
|
Appendix F |
|
|
Appendix G |
|
|
Appendix H |
|
|
Appendix I |
|
|
Appendix J |
|
|
Appendix K |
|
|
Appendix L |
|
|
Appendix M |
Introduction
A1. The Project, Integrated Waste Management Facility (IWMF), is a Designated Project under the Environmental Impact Assessment Ordinance (Cap. 499) (EIAO) and is currently governed by a Further Environmental Permit (FEP No. FEP-01/429/2012/A) for the construction and operation of the Project.
A2. In accordance with the Updated Environmental Monitoring and Audit (EM&A) Manual for the Project, EM&A works for marine water quality, noise, waste management and ecology should be carried out by Environmental Team (ET), Acuity Sustainability Consulting Limited (ASCL), during the construction phase of the Project.
A3. This is the 88th Monthly EM&A Report, prepared by ASCL, for the Project summarizing the monitoring results and audit findings of the EM&A programme at and around Shek Kwu Chau (SKC) during the reporting period from 1 October to 31 October 2025.
Summary of Main Works Undertaken & Key Mitigation Measures Implemented
A4. Key activities carried out in this reporting period for the Project included the following:
· Reclamation Area:
- Superstructure construction
· Seawall Portion:
- Construction of wave wall along the vertical seawall above +3mPD
A5. The key environmental mitigation measures implemented for the Project in this reporting period associated with the construction activities include:
· Reduction of noise from equipment and machinery on-site;
· Sorting, recycling, storage and disposal of general refuse and construction waste;
· Management of chemicals and avoidance of oil spillage on-site;
· Confirmation of the absence of silt content in the rock filling material and the filling work is properly conducted;
· Dust suppression measures for exposed earth surface and stockpile of dusty material; and
· Site runoff control measure during rainstorm.
Summary of Exceedance & Investigation & Follow-up
A6. The EM&A works for construction waste, noise monitoring, coral and White-Bellied Sea Eagle (WBSE) were conducted during the reporting period in accordance with the Updated EM&A Manual.
A7. No exceedance of the Action or Limit Levels in relation to noise, construction waste, coral and WBSE was recorded in the reporting month.
A8. Weekly site inspections of the construction work by ET were carried out on 9, 14, 22 and 28 October 2025 to audit the mitigation measures implementation status. Monthly joint site inspection was carried out on 14 October 2025 by ET and IEC. Observations were recorded in the site inspection checklists and provided to the contractors together with the appropriate follow-up actions where necessary.
Complaint Handling and Prosecution
A9. No project-related environmental complaint was received during the reporting period.
A10. Neither notifications of summons nor prosecution was received for the Project.
Reporting Change
A11. As confirmed with Contractor, no marine construction work is scheduled from December 2024 to June 2025 tentatively. An updated EM&A arrangement for temporary suspension of water quality and line-transect monitoring from February to June 2025 was submitted to EPD on 13 December 2024. EPD advised no objection on the suspension on 25 February 2025. The water quality and line-transect monitoring were then temporarily suspended from 25 February 2025 onward. In light of the absence of marine construction works as specified in the Environmental Impact Assessment (EIA) report (AEIAR 163/2012) and the Updated EM&A manual in October 2025, it was determined that the suspension of water quality monitoring shall remain in effect. Furthermore, given that only land-based construction works were undertaken in October 2025, all conditions and remarks outlined in the updated EM&A arrangement shall continue to be applicable. A two-week advance notice will be made by the Contractor prior to resumption of marine construction works. The water quality monitoring and line-transection monitoring will be resumed upon the resumption of marine construction works. ET will notify the resumption of marine construction works with updated EM&A schedule within one day after receiving the notification from contractor.
A12. Due to adverse weather and sea conditions caused by the residual effects of Super Typhoon RAGASA and the approaching Tropical Cyclone Bualoi, it is not feasible to conduct the 27th quarterly coral monitoring as originally scheduled on 26 September 2025. Consequently, the monitoring was postponed until conditions have improved. The 27th quarterly coral monitoring was then rearranged on 2 October 2025. The monitoring result of the 27th quarterly coral monitoring was documented in Monthly EM&A Report No.88.
Summary of Upcoming Key Issues and Key Mitigation Measures
A13. Key activities anticipated in the next reporting period for the Project will include the following:
- Superstructure construction
· Seawall Portion:
- Construction of wave wall along the vertical seawall above +3mPD
A14. The key environmental mitigation measures for the Project in the coming reporting period associated with the construction activities will include:
· Reduction of noise from equipment and machinery on-site;
· Sorting, recycling, storage and disposal of general refuse and construction waste;
· Management of chemicals and avoidance of oil spillage on-site, especially under heavy rains and adverse weather;
· Dust control of exposed soil surface and stockpile of dusty material at reclaimed area;
· Dust suppression measures for exposed earth surface and stockpile of dusty material; and
· Site runoff control measure during construction works.
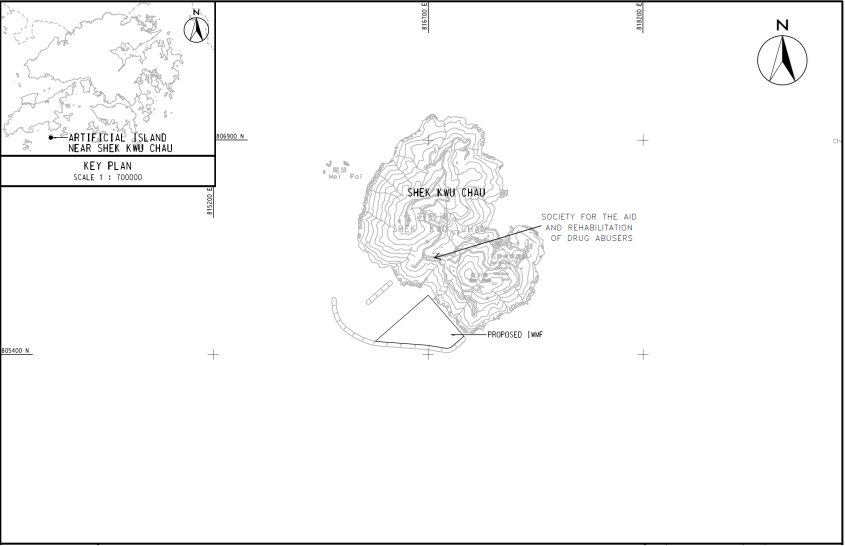
1.1 Background 1.1.1 The Government of Hong Kong SAR will develop the Integrated Waste Management Facilities (IWMF) Phase 1 (hereafter “the Project”) with incineration to achieve substantial bulk reduction of unavoidable municipal solid waste (MSW) and to recover energy from the incineration process. The IWMF will be on an artificial island to be formed by reclamation at the south-western coast of Shek Kwu Chau. Keppel Seghers – Zhen Hua Joint Venture (KSZHJV) was awarded the contract under Contract No. EP/SP/66/12 Integrated Waste Management Facilities Phase 1 to construct and operate the Project. 1.1.2 An environmental impact assessment (EIA) study for the Project has been conducted and the EIA Report was approved under the Environmental Impact Assessment Ordinance on 17 January 2012. An Environmental Permit (EP) (EP No.: EP-429/2012) was granted to EPD on 19 January 2012 for the construction and operation of the Project. Subsequently, the EP was amended (EP No.: EP-429/2012/A) and a further EP (FEP) (EP No.: FEP-01/429/2012/A) was granted to the Keppel Seghers – Zhen Hua Joint Venture (KSZHJV) on 27 December 2017. 1.1.3 A further EP (FEP) (EP No.: FEP-02/429/2012/A) on Submarine Cable for the Development of the Project was granted to CLP Power Hong Kong Limited (CLP) on 17 January 2020. 1.1.4 The key design and construction elements of the Project include the Design and the Works including but not limited to the design, engineering procurement, construction, testing and commissioning of the Facility including:
· Ground Treatment works;
· Seawall and Breakwater construction;
· Non-dredged Reclamation;
· Other Marine works and Harbour and Port Facilities;
· Site formation;
· Municipal Solid Waste (MSW) Treatment Processes;
· Energy Recovery for Power Generation and Surplus Electricity export;
· Wastewater treatment process;
· Desalination and water treatment process;
· Civil works;
· Building and Structural works;
· Electrical and Mechanical works;
· Building Services;
· Architectural and Landscaping works; and
· All other design and works required for the operation and maintenance of the Facility according to the Contract requirements.
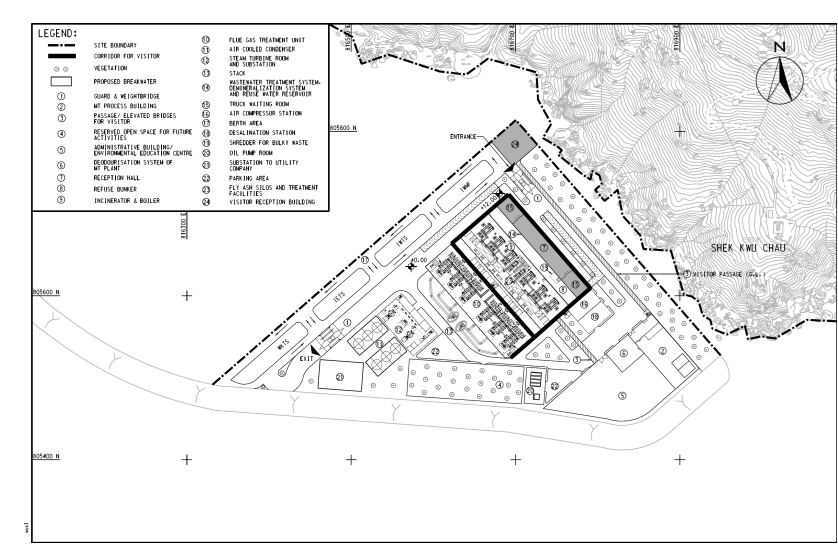
1.1.5 The location of the IWMF near Shek Kwu Chau (SKC) and general layout of IWMF are shown in Figure 1.1 and Figure 1.2 respectively.
|
|
Figure 1.1 Location of the IWMF at the Artificial Island near SKC |
|
|
Figure 1.2 General Layout of the IWMF at the Artificial Island near SKC |
Table 1.1 Contact Details of Key Personnel
|
Party |
Position |
Name |
Telephone no. |
|
Keppel Seghers – Zhen Hua Joint Venture |
Project Manager |
Peter Chung |
2192-0603 |
|
Acuity Sustainability Consulting Limited |
Environmental Team Leader |
F.C. Tsang |
2698-6833 |
|
ERM-Hong Kong, Limited |
Independent Environmental Checker |
Mandy To |
2271-3000 |
Table 1.2 Summary of the Construction Activities Undertaken during the Reporting Month
|
Construction activities undertaken |
Remarks on progress |
|
|
Reclamation area |
· Superstructure construction
|
· On-going |
|
Seawall portion |
· Construction of wave wall along the vertical seawall above +3mPD
|
· On-going
|
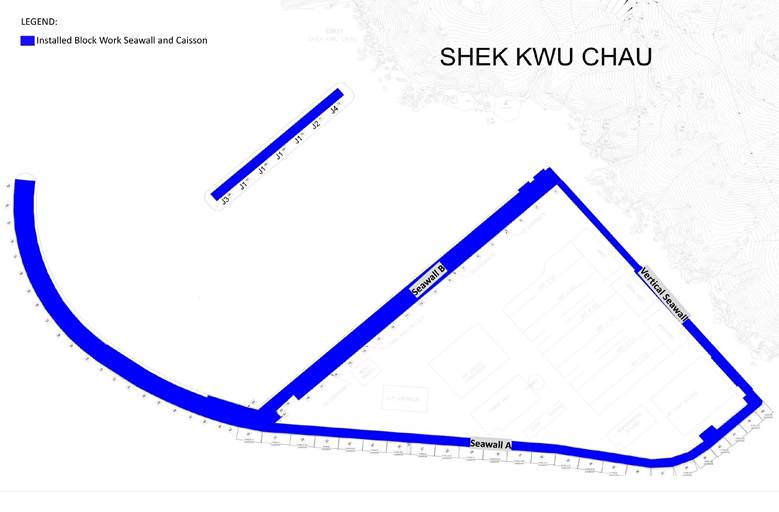 |
| Figure 1.4 Location of Major Construction Activities Undertaken during the Reporting Month |
Table 1.3 Summary of the Status of Valid Environmental Licence, Notification, Permit and Documentations
|
Reference |
Validity Period |
Remarks |
|
|
Variation of Environmental Permit |
EP-429/2012/A |
Throughout the Contract |
|
|
Further Environmental Permit |
FEP-01/429/2012/A |
Throughout the Contract |
|
|
Notification of Construction Works under the Air Pollution Control (Construction Dust) Regulation (Form NA) |
Ref No.: 10009615 |
30/09/2024 –31/08/2026 |
|
|
Wastewater Discharge Licence |
1.1.1. WT00039438-2021 |
1.1.2. 15/02/2022 – 28/02/2027 |
|
|
Chemical Waste Producer Registration |
WPN0017-933-K3301-01 |
Throughout the Contract |
The revised registration form was issued by EPD on 14 April 2025, the original registration form issued on 3 January 2018 was cancelled |
|
WPN5213-961-K3301-02 |
Throughout the Contract |
|
|
|
WPN5296-839-K3301-03 |
Throughout the Contract |
||
|
Construction Noise Permit (24 hours) |
1.1.3. GW-RS0802-25 |
1.1.4. 07/08/2025- 06/02/2026 |
1.1.5. Portion 1, 1A & 1B |
|
Billing Account for Disposal of Construction Waste |
A/C No.:7029768 |
Throughout the Contract |
|
Table 1.4 Summary of Status for Key Environmental Aspects under the Updated EM&A Manual
|
Baseline Monitoring under Updated EM&A Manual and Detailed Plan on DCM |
The baseline water quality monitoring result has been reported in Baseline Monitoring Report and submitted to EPD under FEP Condition 3.4 |
|
As confirmed with Contractor, no marine construction work is scheduled from December 2024 to June 2025 tentatively. An updated EM&A arrangement for temporary suspension of water quality and line-transect monitoring from February to June 2025 was submitted to EPD on 13 December 2024. EPD advised no objection on the suspension on 25 February 2025. The water quality and line-transect monitoring were then temporarily suspended from 25 February 2025 onward. In light of the absence of marine construction works as specified in the Environmental Impact Assessment (EIA) report (AEIAR 163/2012) and the Updated EM&A manual in October 2025, it was determined that the suspension of water quality monitoring shall remain in effect. Furthermore, given that only land-based construction works were undertaken in October 2025, all conditions and remarks outlined in the updated EM&A arrangement shall continue to be applicable. A two-week advance notice will be made by the Contractor prior to resumption of marine construction works. The water quality monitoring and line-transection monitoring will be resumed upon the resumption of marine construction works. ET will notify the resumption of marine construction works with updated EM&A schedule within one day after receiving the notification from contractor. |
|
|
All DCM was completed on 14 October 2020, regular DCM monitoring for further 4 weeks (i.e form 16 October 2020 to 14 November 2020) was completed according to the approved Detailed Plan on Deep Cement Mixing |
|
|
Conducted from 11 February 2019 to 10 March 2019, had not been resumed since there was no DCM related parameter exceeding the AL/LL. |
|
|
Operational Phase Baseline Water Quality Monitoring |
Operational phase baseline water quality monitoring was conducted at all designated monitoring stations—C3, C4, Z1, Z2, and Z3—three days per week, during mid-flood and mid-ebb tides, for a minimum duration of four weeks preceding the commencement of brine water discharge within the reporting period in accordance with the Updated EM&A Manual. The baseline water quality monitoring at the designated stations was carried out between 18 August 2025 and 12 September 2025. Comprehensive monitoring results were compiled and presented in the Operational Phase Baseline Water Quality Monitoring Report.
|
|
The baseline noise monitoring result has been reported in Baseline Monitoring Report and submitted to EPD under FEP Condition 3.4 |
|
|
The Coral Translocation Plan was submitted and approved by EPD under EP Condition 2.12 |
|
|
Survey affected by missing of translocated and tagged coral colonies after typhoons in September 2018, completed on 28 March 2019. |
|
|
Survey obstructed due to missing of tagged coral colonies after typhoons in September 2018 |
|
|
Re-tagging at Indirect Impact Site was conducted on 23 November and Re-tagging at Control Site was conducted on 3 December 2018. |
|
|
On-going. Due to adverse weather and sea conditions caused by the residual effects of Super Typhoon RAGASA and the approaching Tropical Cyclone Bualoi, it is not feasible to conduct the 27th quarterly coral monitoring as originally scheduled on 26 September 2025. Consequently, the monitoring was postponed until conditions have improved. The 27th quarterly coral monitoring was then rearranged on 2 October 2025. The monitoring result of the 27th quarterly coral monitoring was documented in Monthly EM&A Report No.88. |
|
|
The baseline marine mammal monitoring result has been reported in Baseline Monitoring Report and submitted to EPD under FEP Condition 3.4 |
|
|
Temporarily suspended since 25 February 2025, as no marine construction works as defined in the approved EIA report (AEIAR-163/2012) and the Updated EM&A Manual was conducted in this reporting month. |
|
|
30 days of theodolite surveys were started on 21 February 2019 and completed in May 2019. |
|
|
30 days of PAM surveys were started on 1 May 2019 and completed by the end of May 2019. |
|
|
The baseline WBSE monitoring result has been reported in Baseline Monitoring Report and submitted to EPD under FEP Condition 3.4 |
|
|
On-going |
|
|
Site Inspection covering Measures of Air Quality, Noise Impact, Water Quality, Waste, Ecological Quality, Fisheries, Landscape and Visual |
|
|
Installation of caisson No.19 was completed on 18 March 2021, which the reclamation area had been totally enclosed by permanent structure. Floating type silt curtain at marine access was removed on 18 March 2021. No enclosed area shall be formed by deployment of silt curtain for the remaining works programme. |
|
|
Mitigation Measures in Detailed Monitoring Programme on Finless Porpoise (DMPFP) |
Installation of caisson No.19 was completed on 18 March 2021, which the reclamation area had been totally enclosed by permanent structure. Floating type silt curtain at marine access was removed on 18 March 2021. No enclosed area shall be formed by deployment of silt curtain for the remaining works programme. |
2. Marine Water Quality Monitoring
2.1 Impact Water Quality Monitoring during Construction Phase 2.1.1 Water Quality Requirements2.1.1.1 To ensure no adverse water quality impact, water quality monitoring is recommended to be carried out at the nearby water sensitive receivers (WSRs) during construction phase including proposed reclamation, breakwater construction, etc.
2.1.1.2 In accordance with the Updated EM&A Manual, impact water quality monitoring were conducted 3 days per week at mid-flood and mid-ebb tide to obtain impact water quality levels at the eleven monitoring stations during general water quality monitoring for the reporting period.
2.1.2 Water Quality Parameters, Time, Frequency2.1.2.1 Dissolved Oxygen (DO), Turbidity, Suspended Solids (SS), Salinity and pH have been undertaken at the eleven monitoring stations during general water quality monitoring.
2.1.2.2 DO, temperature, salinity, turbidity and pH have been measured in-situ and the SS, has been assayed in a HOKLAS laboratory.
2.1.2.3 In associate with the water quality parameters, other relevant data were also measured, such as monitoring location/position, time, water depth, sampling depth, tidal stages, weather conditions and any special phenomena or work underway nearby were also recorded. The monitoring schedule is provided in Appendix C.
2.1.2.4 Impact water quality monitoring was conducted 3 days per week in the reporting period. All parameters were monitored during mid-flood and mid-ebb tides at three water depths for general water quality monitoring. The interval between two sets of monitoring has not been less than 36 hours.
2.1.2.5 Table 2.1 summarizes the monitoring parameters, frequency and duration of the impact water quality monitoring during construction phase.
Table 2.1 Water Quality Monitoring Parameters, Frequency and Duration
|
Parameter, unit |
Frequency |
No. of Depths |
|
· Water Depth (m) · Temperature (oC) · Salinity (ppt) · pH (pH unit) · Dissolved Oxygen (DO) (mg/L and % of saturation) · Turbidity (NTU) · Suspended Solids (SS), mg/L |
General water quality monitoring : 3 days per week, at mid-flood and mid-ebb tides |
3 water depths: 1m below sea surface, mid-depth and 1m above sea bed.
If the water depth is less than 3m, mid-depth sampling only. If water depth less than 6m, mid-depth may be omitted.
|
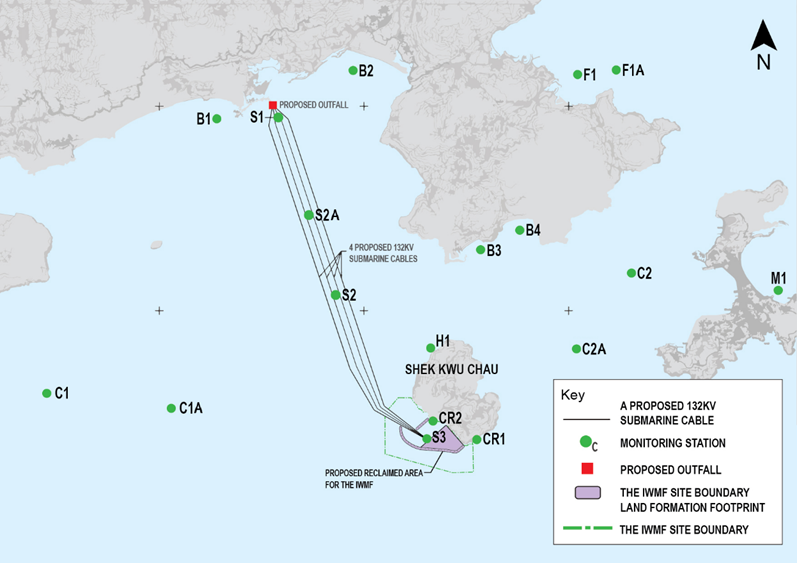
2.1.3.1 Impact water quality monitoring was conducted at eleven monitoring locations (B1-B4, H1, C1, C2, F1, CR1, CR2 & M1) during general water quality monitoring in the reporting period as shown in Figure 2.1. As per the relocation proposal verified by IEC and approved by EPD, the monitoring location C1, C2, S2, F1 are relocated at C1A, C2A, S2A, F1A as equivalent points respectively to clear up the concerns from stakeholders.
|
|
|||
|
Figure 2.1 Water monitoring locations at Artificial Island near SKC |
2.1.3.2 B1 to B4 are located at 4 beaches respectively at the southern shore of Lantau Island. Monitoring station H1 is located at the horseshoe crab habitat at northern SKC, while CR1 and CR2 are located at the coral communities at southwestern shore of SKC. Monitoring station F1 is located at the Cheung Sha Wan Fish Culture Zone while monitoring station M1 is located at Tung Wan at Cheung Chau. Monitoring station F1A is relocated for F1 at the Cheung Sha Wan Fish Culture Zone. S1, S2 and S3 are located at the northern landing site, midway and southern landing site of the proposed submarine cable, respectively. S2A is the relocated monitoring station of S2 which represents the midway landing site of the proposed submarine cable. S1, S2/S2A and S3 are required for monitoring due to the laying of submarine cable. Control stations C1 and C2 at far field locations are for comparison. Control stations C1A and C2A are relocated for C1 and C2 respectively as equivalent far field locations for comparison.
2.1.3.3 Fourteen monitoring stations are listed in Table 2.2.
Table 2.2 Locations of Marine Water Quality Stations
|
Monitoring station |
Description |
Easting |
Northing |
|
B1 |
Beach – Cheung Sha Lower |
813342 |
810316 |
|
B2 |
Beach – Pui O |
815340 |
811025 |
|
B3 |
Beach – Yi Long Wan |
817210 |
808395 |
|
B4 |
Beach – Tai Long Wan |
817784 |
808682 |
|
H1 |
Horseshoe Crab – Shek Kwu Chau |
816477 |
806953 |
|
C1 |
Control Station (note i) |
810850 |
806288 |
|
C1A |
Relocated Control Station |
812823 |
806300 |
|
C2 |
Control Station (note ii) |
819421 |
808053 |
|
C2A |
Relocated Control Station |
818869 |
806808 |
|
F1 |
Cheung Sha Wan Fish Culture Zone (note iii) |
818631 |
810966 |
|
F1A |
Cheung Sha Wan Fish Culture Zone |
819109 |
810924 |
|
S1 |
Submarine Cable Landing Site |
814245 |
810335 |
|
S2 |
Submarine Cable (note iv) |
815076 |
807747 |
|
S2A |
Submarine Cable |
814808 |
808515 |
|
S3 |
Submarine Cable Landing Site |
816420 |
805621 |
|
CR1 |
Coral |
817144 |
805597 |
|
CR2 |
Coral |
816512 |
805882 |
|
M1 |
Tung Wan |
821572 |
807799 |
i. Relocated to C1A in Mar 2019
ii. Relocated to C2A in Mar 2019
iii. Relocated to S2A in Mar 2019
iv. Relocated to F1A in Mar 2019
2.1.4 Impact Monitoring Methodology
2.1.4.1 General water quality monitoring was conducted three days per week, at mid-flood and mid-ebb tides, at the designated water quality monitoring stations during the reporting period.
2.1.4.2 The interval between 2 sets of monitoring was not less than 36 hours. Sampling was collected at three water depths, namely, 1m below water surface, mid-depth and 1m above seabed, except where the water depth is less than 6m, the mid-depth was omitted. If the water depth was less than 3m, only the mid-depth station was monitored.
2.1.4.3 Duplicate in-situ measurements and water sampling were carried out in each sampling event. The monitoring probes were retrieved out of water after the first measurement and then redeployed for the second measurement. When the difference in value between the first and second readings of DO or turbidity is more than 25% of the value of the first reading, the reading would be discarded and further readings would be taken.
In-situ Measurement
2.1.4.4 Levels of DO, pH, temperature, turbidity and salinity would be measured in-situ by portable and weatherproof measuring instrument, e.g. YSI ProDSS and Horiba U-53 Multiparameter complete with cable and sensor. (Refer to http://www.ysi.com/ProDSS for YSI ProDSS technical specification and https://static.horiba.com/fileadmin/Horiba/Products/Process_and_Environmental/Water_Pollution/Instruction_Manuals/U-50/U-50_SS_E.pdf for Horiba U-53 technical specification). Water current velocity and water current direction would be measured by portable and weatherproof current meter, e.g. SonTek Hydrosurveyor (Refer to https://www.sontek.com/hydrosurveyor for SonTek Hydrosurveyor M9 technical specification). Parameters measured by in-situ measurement is tabulated in Table 2.3
Table 2.3 Parameters Measured by In-situ Measurement
|
Parameter |
Resolution |
Range |
|
Temperature |
0.1 oC |
-5-70 oC |
|
Dissolved Oxygen (DO) |
0.01 mg/L |
0-50.0 mg/L |
|
Turbidity |
0.1 NTU |
0-1000 NTU |
|
pH |
pH 0.01 |
pH 0-14 |
|
Salinity |
0.01 ppt |
0-40 ppt |
|
Water Current Velocity |
0.001m/s |
±20m/s |
|
Water Current Direction |
±1o |
±2o |
Laboratory Analysis
2.1.4.5
Analysis
of SS shall be carried out in a HOKLAS accredited laboratory. Sufficient water
samples shall be collected at the monitoring stations for carrying out the
laboratory determinations. The determination work shall be started within 24
hours after collection of the water samples. Analytical methods and detection
limits for SS is presented in Table 2.4.
Table 2.4 Analytical Methods Applied to Water Quality Samples
|
Parameter |
Analytical method |
Detection Level |
|
Suspended Solids, SS |
APHA 2540 Di |
1 mg/L |
i. “APHA 2540 D” stands for American Public Health Association Standard Methods for the Examination of Water and Wastewater, 23rd Edition.
Field Log
2.1.4.6 Other relevant data was recorded, such as: monitoring location / position, time, water depth, weather conditions and any special phenomena underway near the monitoring station.
2.1.5 Monitoring Equipment2.1.5.1 Equipment used in the impact water quality monitoring programme is summarized in Table 2.5 below.
Table 2.5 Impact Water Quality Monitoring Equipment
|
Monitored Parameter |
Equipment |
Brand and Model |
|
DO, Temperature, Salinity, pH and Turbidity |
Multi-functional Meter |
YSI ProDSS Multi Parameter |
|
Coordinates |
Positioning Equipment |
Garmin GPSMAP 78s |
|
Water depth |
Water Depth Detector |
Hummingbird 160 Portable |
|
SS |
Water Sampler |
Wildco 2 L Water Sampler with messenger |
Dissolved Oxygen and Temperature Measuring Equipment
2.1.5.2 The instrument is a portable and weatherproof DO probe mounted on the multi-functional meter complete with cable and sensor and is powered by a DC supply source. The equipment was capable of measuring:
l A DO level in the range of 0 ‑ 50 mg/L; and
l Temperature of -5 ‑ 70 degree Celsius.
Turbidity Measurement Instrument
2.1.5.3 The instrument is a portable and weatherproof turbidity-measuring probe mounted on the multi-functional meter and is powered by a DC supply source. The instrument is equipped with a photoelectric sensor which is capable of measuring turbidity between 0 – 1000 NTU.
pH Measurement Instrument
2.1.5.4 The probe consists of a potentiometer, a glass electrode, a reference electrode and a temperature-compensating device mounted on the multi-functional meter. It is readable to 0.1 pH in a range of 0 to 14. Standard buffer solutions of at least pH 7 and pH 10 were used for calibration of the instrument before and after use.
Salinity Measurement Instrument
2.1.5.5 A portable salinometer mounted on the multi-functional meter capable of measuring salinity in the range of 0-40 parts per thousand (ppt) was provided for measuring salinity of the water at each monitoring location.
Sampler
2.1.5.6 The water sampler comprises a transparent PVC cylinder, with a capacity of not less than 2 litres, which can be effectively sealed with latex cups at both ends. The sampler has a positive latching system to keep it open and prevent premature closure until released by a messenger when the sampler is at the selected water depth.
Sample Containers and Storage
2.1.5.7 Water samples for SS were stored in high density polythene bottles with no preservative added, packed in ice (cooled to 4°C without being frozen) and delivered to the laboratory and analysed as soon as possible after collection. Sufficient volume of samples was collected to achieve the detection limit stated in Table 2.4.
Water Depth Detector
2.1.5.8 A portable, battery-operated echo sounder was used for the determination of water depth at each designated monitoring station. This unit could either be hand-held or affixed to the bottom of the work boat, if the same vessel is to be used throughout the monitoring programme.
Monitoring Position Equipment
2.1.5.9 Hand-held digital Differential Global Positioning System (DGPS) with way point bearing indication and Radio Technical Commission for maritime (RTCM) Type 16 error message ‘screen pop-up’ facilities (for real-time auto-display of error messages and DGPS corrections from the Hong Kong Hydrographic Office) was provided and used to ensure that the water sampling locations were correct during the water quality monitoring work.
Maintenance and Calibration
2.1.5.10 The multi-functional meters were checked and calibrated before use. Multi-functional meters were certified by a laboratory accredited under HOKLAS or any other international accreditation scheme, and subsequently re-calibrated at three monthly intervals throughout all stages of the water quality monitoring. Responses of sensors and electrodes were checked with certified standard solutions before each use. Wet bulb calibration for a DO meter was carried out before commencement of monitoring and after completion of all measurements each day. Calibration was not conducted at each monitoring location as daily calibration is adequate for the type of DO meter employed.
2.1.5.11 Sufficient stocks of
spare parts were provided and maintained for replacements when necessary.
Backup monitoring equipment was prepared for uninterrupted monitoring during
equipment maintenance or calibration during monitoring.
2.1.6.1 The Action and Limit Levels have been set based on the derivation criteria specified in the Updated EM&A Manual and Detailed DCM Plan, as shown in Table 2.6 below.
2.1.6.2
Table 2.6 Criteria of Action and Limit Levels for Water Quality (Construction Phase)
|
Parameters |
Action |
Limit |
|
Construction Phase Impact Monitoring |
||
|
DO in mg/L |
≤ 5 %-ile of baseline data |
≤ 4 |
|
SS in mg/L |
≥ 95 %-ile of baseline data or 120% of control station’s SS at the same tide of the same day of measurement, whichever is higher |
≥ 99 %-ile of baseline data or 130% of control station’s SS at the same tide of the same day of measurement, whichever is higher |
|
Turbidity in NTU |
≥ 95 %-ile of baseline data or 120% of control station’s turbidity at the same tide of the same day of measurement, whichever is higher |
≥ 99 %-ile of baseline data or 130% of control station’s turbidity at the same tide of the same day of measurement, whichever is higher |
|
Temperature in°C |
1.8°C above the temperature recorded at representative control station at the same tide of the same day |
2°C above the temperature recorded at representative control station at the same tide of the same day |
2.1.6.3 Based on the baseline monitoring data and the derivation criteria specified above, the Action/Limit Levels have been derived and are presented in Table 2.7 and Table 2.8 for both dry seasons (October – March) and wet seasons (April – September).
Table 2.7 Derived Action and Limit Levels for Water Quality Monitoring (Dry Season)
|
Parameters |
Action |
Limit |
|
Construction Phase Impact Monitoring |
||
|
DO in mg/L |
≤ 7.13 |
≤ 4 |
|
SS in mg/L |
≥ 8 or 120% of control station’s SS at the same tide of the same day of measurement, whichever is higher |
≥ 10 or 130% of control station’s SS at the same tide of the same day of measurement, whichever is higher |
|
Turbidity in NTU |
≥ 5.6 or 120% of control station’s turbidity at the same tide of the same day of measurement, whichever is higher |
≥ 12.8 or 130% of control station’s turbidity at the same tide of the same day of measurement, whichever is higher |
|
Temperature in°C |
1.8°C above the temperature recorded at representative control station at the same tide of the same day |
2°C above the temperature recorded at representative control station at the same tide of the same day |
Notes:
i. “Depth-averaged” is calculated by taking the arithmetic means of reading of all three depths.
ii. For DO, non-compliance of the water quality limits occurs when monitoring result is lower than the limits.
iii. For turbidity, SS and Salinity, non-compliance of the water quality limits occurs when monitoring result is higher than the limits.
Table 2.8 Derived Action and Limit Levels for Water Quality (Wet Season)
|
Parameters |
Action |
Limit |
|
Construction Phase Impact Monitoring |
||
|
DO in mg/L |
≤ 5.28 |
≤ 4 |
|
SS in mg/L |
≥ 12 or 120% of control station’s SS at the same tide of the same day of measurement, whichever is higher |
≥ 14 or 130% of control station’s SS at the same tide of the same day of measurement, whichever is higher |
|
Turbidity in NTU |
≥ 4.0 or 120% of control station’s turbidity at the same tide of the same day of measurement, whichever is higher |
≥ 4.3 or 130% of control station’s turbidity at the same tide of the same day of measurement, whichever is higher |
|
Temperature in°C |
1.8°C above the temperature recorded at representative control station at the same tide of the same day |
2°C above the temperature recorded at representative control station at the same tide of the same day |
Notes:
i. “Depth-averaged” is calculated by taking the arithmetic means of reading of all three depths.
ii. For DO, non-compliance of the water quality limits occurs when monitoring result is lower than the limits.
iii. For turbidity, SS and Salinity, non-compliance of the water quality limits occurs when monitoring result is higher than the limits.
2.1.6.4 If exceedances were found during water quality monitoring, the actions in accordance with the Event and Action Plan shall be carried out according to Appendix D.
2.1.7 Monitoring Results and Observations2.1.7.1 As confirmed by the Contractor on 14 October 2020, all DCM works was completed on 14 October 2020, the post DCM water quality monitoring was completed for further 4 weeks (i.e. from 16 October 2020 to 14 November 2020) according to the approved Detailed Plan on Deep Cement Mixing. As all DCM work and post DCM water quality monitoring were completed, no water quality monitoring was conducted at S1, S2A and S3 during the reporting period. As marine construction works as defined in the approved EIA report (AEIAR-163/2012) and the Updated EM&A Manual was conducted in October 2024, impact water quality monitoring was resumed in October 2024.
2.1.7.2 As confirmed with Contractor, no marine construction work is scheduled from December 2024 to June 2025 tentatively. EPD advised no objection on the temporary suspension of water quality on 25 February 2025. The water quality monitoring was then temporarily suspended from 25 February 2025 onward.
2.1.7.3 In light of the absence of marine construction works as specified in the Environmental Impact Assessment (EIA) report (AEIAR 163/2012) and the Updated EM&A manual in October 2025, it was determined that the suspension of water quality monitoring shall remain in effect. Furthermore, given that only land-based construction works were undertaken in October 2025, all conditions and remarks outlined in the updated EM&A arrangement shall continue to be applicable.
2.2 Operational Phase Baseline Water Quality Monitoring 2.2.1 Monitoring Requirements2.2.1.1 In accordance with the Updated EM&A Manual (Rev. E), baseline water quality monitoring was taken at all of the designated monitoring stations, 3 days per week, at mid-flood and mid-ebb tides, for at least 4 weeks prior to the commission of the brine water discharge. No construction activities were in the vicinity of the stations during the baseline monitoring. The interval between 2 sets of monitoring was not less than 36 hours.
2.2.1.2 Measurement was made at 3 water depths, namely, 1 m below water surface, mid-depth and 1 m above seabed. If the sampling water depth was less than 6 m, the mid-depth was omitted. For water depth that was less than 3 m, only the mid-depth station was monitored. Duplicate in-situ measurements were carried out in each sampling event.
2.2.2 Baseline Monitoring Locations2.2.2.1 Water quality monitoring was proposed near the outfall for concentrated brine and surrounding the Zone of Initial Mixing (ZIM). The proposed monitoring locations are listed in Table 2.9 below and shown in Figure 2.2.
Table 2.9 Proposed Marine Water Quality Stations for Baseline and Impact Monitoring during Operational Phase|
Monitoring Stations |
Description |
Easting |
Northing |
|
C3 |
Control Station |
817065 |
805416 |
|
C4 |
Control Station |
816484 |
805416 |
|
Z1 |
Near the Edge of ZIM (east of the brine water outfall) |
816883 |
805424 |
|
Z2 |
Near the Edge of ZIM (south of the brine water outfall) |
816772 |
805317 |
|
Z3 |
Near the Edge of ZIM (west of the brine water outfall) |
816685 |
805429 |
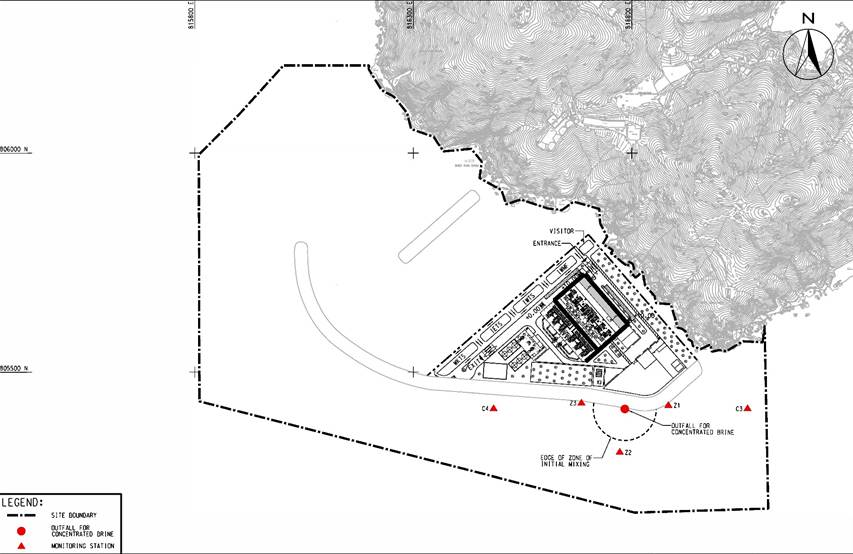
Figure 2.2 Location Plan of Proposed Monitoring Stations for Operational Phase Water Quality Monitoring
2.2.3.1 Salinity was monitored at designated water quality monitoring stations. The levels of salinity was measured in-situ.
2.2.3.2 Other relevant data was also be recorded, including monitoring location / position, time, water depth, weather conditions and any special phenomena or work underway at the construction site.
2.2.4 Monitoring EquipmentWater Depth Detector
2.2.4.1 A portable, battery-operated echo sounder was used for the determination of water depth at each designated monitoring station.
Salinity
2.2.4.2 A portable salinometer capable of measuring salinity in the range of 0 - 40 parts per thousand (ppt) was provided for measuring salinity of the water at each monitoring location.
Backup Equipment
2.2.4.3 Sufficient stocks of spare parts were maintained for replacements when necessary. Backup monitoring equipment was available so that monitoring can proceed uninterrupted even when some equipment was under maintenance, calibration, malfunction etc.
2.2.5 Quality ControlField Logs
2.2.5.1 Field logs were maintained for all monitoring work, noting the date, equipment, monitoring personnel and the record of all construction related activities and observations. The field log records were retained for the duration of the entire project and archived on completion.
2.2.5.2 In-situ monitoring results were digitally recorded from the instruments and converted into spreadsheet format or manually noted. Both hard and soft copies shall be retained for file records. Any deviation from the standard procedure and the reasons for deviation were noted in the log.
Measurement Procedures
2.2.5.3 All in-situ monitoring instruments were checked, calibrated and certified and subsequently re-calibrated at three monthly intervals throughout all stages of the water quality monitoring, or as required by the manufactures specification. Certificate(s) of Calibration specifying the instrument will be attached to the monitoring reports.
2.2.6 Action and limit levels2.2.6.1 The criteria of action and limit levels for water quality monitoring are defined in Table 2.10.
Table 2.10 Action and Limit Levels for Water Quality (Operational Phase)|
Action Level |
Limit Level |
|
|
Salinity in mg/L (depth average) |
≥95 %-ile of baseline data or 105% of control station’s salinity at the same tide of the same day of measurement |
≥99 %-ile of baseline data or 109% of control station’s salinity at the same tide of the same day of measurement |
Notes:
i. “Depth average” is calculated by taking the arithmetic mean of all three depths.
ii. For salinity, non-compliance of the water quality limit occurs when monitoring result is higher than the limit.
2.2.6.2 Based on the baseline monitoring data and the derivation criteria specified in Table 2.10, the Action/Limit Levels have been derived and are presented in Table 2.11.
Table 2.11 Derived Action and Limit Levels for Water Quality (Operational Phase)
|
Parameters |
Action Level |
Limit Level |
|
Salinity in ppm (depth average) |
≥ 29750 ppm (29.75 ppt) or 105% of control station’s salinity at the same tide of the same day of measurement |
≥ 30140 ppm (30.14 ppt) or 109% of control station’s salinity at the same tide of the same day of measurement |
Notes:
i. “Depth average” is calculated by taking the arithmetic mean of all three depths.
ii. For salinity, non-compliance of the water quality limit occurs when monitoring result is higher than the limit.
2.2.7 Event and Action Plan
2.2.7.1 The Action and Limit levels for water quality are shown in Table 2.10. Should non-compliance of the criteria occur, action in accordance with the Event/ Action Plans in Appendix D shall be carried out.
2.2.8 Monitoring Results and Observations
The baseline water quality monitoring for the monitoring stations as listed in Table 2.9 was carried out between 18 August 2025 and 12 September 2025. Comprehensive monitoring results were compiled and presented in the Operational Phase Baseline Water Quality Monitoring Report.
3.1 Monitoring Requirements 3.1.1 To ensure no adverse noise impact, noise monitoring is recommended to be carried out at the nearby noise sensitive receivers (NSRs) during construction phase. 3.1.2 In accordance with the Updated EM&A Manual, baseline noise level at the noise monitoring stations was established as presented in the Baseline Monitoring Report. Impact noise monitoring was conducted once per week in the form of 30-minutes measurements Leq, L10 and L90 levels recorded at each monitoring station between 0700 and 1900 hours on normal weekdays. 3.1.3 In accordance with the Updated EM&A Manual, additional weekly impact monitoring should be carried out during respective restricted hours period (1900 – 0700 hours) if the construction works were conducted at evening and night time. Additional weekly noise monitoring was conducted once per week in the form of 5-minutes measurements Leq, L10 and L90 levels recorded at each monitoring station between 1900 and 0700 hours as well as public holidays and Sundays. 3.2 Noise Monitoring Parameters, Time, Frequency 3.2.1 Impact noise monitoring was conducted weekly in the reporting period between 0700 and 1900 hours on normal weekdays. Additional impact noise monitoring was conducted weekly in the reporting period between 1900-0700 hours on all days as well as public holidays and Sundays. 3.2.2 Construction noise level measured in terms of the A-weighted equivalent continuous sound pressure level (LAeq). Leq 30min was used as the monitoring parameter for the time period between 0700 and 1900 hours on normal weekdays. Leq 5min was used as the monitoring parameter for the time period between 1900 and 0700 hours as well as public holidays and Sundays. Table 3.1 summarizes the monitoring parameters, frequency and duration of the impact noise monitoring and additional impact noise monitoring. The monitoring schedule is provided in Appendix C.
Table 3.1 Noise Monitoring Parameters, Time, Frequency and Duration
|
Monitoring Station |
Time |
Duration |
Parameters |
|
M1/ N_S1, M2/ N_S2, M3/ N_S3 |
Day time: 0700-1900 hrs (during normal weekdays) |
Once per week Leq 5min/Leq 30min (average of 6 consecutive Leq 5min) |
Leq, L10 & L90 |
|
Evening time: 1900-2300 hrs (including normal weekdays, also public holidays and Sundays) |
Once per week Leq 5min (3 sets of Leq 5min) |
Leq, L10 & L90 |
|
|
Night time: 2300-0700 hrs (including normal weekdays, also public holidays and Sundays) |
Once per week Leq 5min (3 sets of Leq 5min) |
Leq, L10 & L90 |
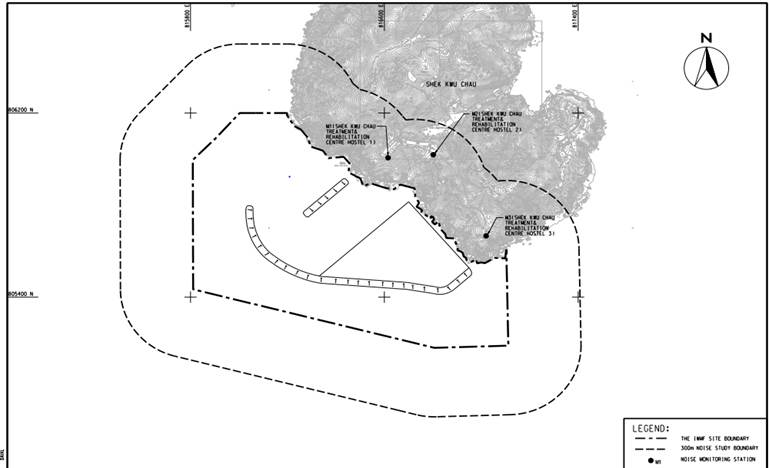
Table 3.2 Noise Monitoring Location
|
Station |
NSR ID in EIA Report |
Noise Monitoring Location |
Type of sensitive receiver(s) |
Measurement Type |
|
M1 |
N_S1 |
Shek Kwu Chau Treatment & Rehabilitation Centre Hostel 1 |
Residential |
Façade |
|
M2 |
N_S2 |
Shek Kwu Chau Treatment & Rehabilitation Centre Hostel 2 |
Residential |
Façade |
|
M3 |
N_S3 |
Shek Kwu Chau Treatment & Rehabilitation Centre Hostel 3 |
Residential |
Façade |
l The microphone head of the sound level meter was normally positioned 1 m exterior of the noise sensitive façade and lowered sufficiently so that the building’s external wall acts as a reflecting surface.
l If there is a problem with the access to the normal monitoring position, an alternative may be chosen and appropriate correction would be applied according to acoustic principle when necessary. For reference, +3 dB(A) correction would be made for free-field measurements.
l The battery condition was checked to ensure good functioning of the meter.
l Parameters such as frequency weighting, the time weighting and the measurement time were set as follows:
- Frequency weight: A
- Time weighting: Fast
- Measurement time: 5 minutes
l Prior to and after noise measurement, the meter was calibrated using the calibrator for 94.0 dB at 1000Hz. If the difference in the calibration level before and after measurement is more than 1.0 dB, the measurement was considered invalid and repeat of noise measurement was required after re-calibration or repair of the equipment.
l Noise monitoring was carried out for 30 minutes by sound level meter. At the end of the monitoring period, noise levels in terms of Leq, L10 and L90 were recorded. In addition, site conditions and noise sources were recorded when the equipment was checked and inspected.
l All the monitoring data within the sound level meter system was downloaded through the computer software.
3.5 Monitoring Equipment 3.5.1 Integrated sound level meter was used for the noise monitoring. The meter shall comply with the International Electrotechnical Commission Publications 651: 1979 (Type 1) and 804: 1985 (Type 1) specifications. 3.5.2 Equipment used in the impact noise monitoring programme is summarized in Table 3.3 below. Calibration certificates for the noise monitoring equipment are attached in Appendix E.Table 3.3 Impact Noise Monitoring Equipment
|
Equipment |
Brand and Model |
|
Sound Level Meter |
SVANTEK 971 |
|
Sound Calibrator |
RION NC-74 |
l The microphone head of the sound level meter and calibrator were cleaned with a soft cloth at quarterly intervals.
l The sound level meter and calibrator were checked and calibrated at yearly intervals
l Immediately prior to and following each noise measurement, the accuracy of the sound level meter shall be checked using an acoustic calibrator generating a known sound pressure level at a known frequency. Measurements may be accepted as valid only if the calibration levels from before and after the noise measurement agree to within 1.0dB.
3.7 Action and Limit Levels 3.7.1 The Action/Limit Levels in line with the criteria of Practice Note for Professional Persons (ProPECC PN 2/93) “Noise from Construction Activities – Non-statutory Controls” and Technical Memorandum on Environmental Impact Assessment Process issued by HKSAR Environmental Protection Department [“EPD”] under the Environmental Impact Assessment Ordinance, Cap 499, S.16 is presented in Table 3.4.Table 3.4 Action and Limit Levels for Noise per Updated EM&A Manual
|
Time Period |
Action |
Limit (dB(A)) |
|
0700-1900 hrs on normal weekdays |
When one documented complaint is received |
75 dB(A) |
Notes: If works are to be carried out during restricted hours, the conditions stipulated in the Construction Noise Permit (CNP) issued by the Noise Control Authority have to be followed.
3.7.2 If exceedances were found during noise monitoring, actions in accordance with the Event and Action Plan shall be carried out according to Appendix F. 3.8 Monitoring Results and Observations 3.8.1 Impact monitoring for noise impact for daytime was carried out on 8, 13, 22 and 27 October 2025. Impact monitoring for noise impact for evening time and nighttime was carried out on 8&9, 13&14, 2&23 and 27&28 October 2025. The impact noise levels at Noise Monitoring Stations at SKC (i.e. M1/N_S1 to M3/N_S3) are summarized in Table 3.6, Table 3.7 and Table 3.8 respectively. Details of noise monitoring results are presented in Appendix G. 3.8.2 Major construction activity, major noise source and extreme weather which might affect the results were recorded during the impact monitoring. 3.8.3 According to our field observations, the major noise source identified at the noise monitoring station in the reporting month are summarised in Table 3.5. Air conditioning units and air quality monitoring station were also observed nearby monitoring stations M3.Table 3.5 Summary of Field Observation
|
Monitoring Station |
Major Noise Source |
|
M1 |
NA |
|
M2 |
NA |
|
M3 |
Operation of nearby Air Quality Monitoring Station |
Table 3.6 Summary of Impact Noise Monitoring Results during Day Time (0700 – 1900 hours)
|
Location |
Measured Noise Level in dB(A) |
||
|
Range of Leq 30min |
Range of L10 30min |
Range of L90 30min |
|
|
M1 |
55.3 – 58.6 |
57.0 – 61.3 |
53.2 – 55.8 |
|
M2 |
53.2 – 57.6 |
55.7 – 58.9 |
51.0 – 55.6 |
|
M3 |
49.7 – 57.5 |
51.1 – 57.7 |
46.5 – 56.7 |
Table 3.7 Summary of Additional Impact Noise Monitoring Results during Evening Time (1900 – 2300 hours)
|
Location |
Measured Noise Level in dB(A) |
||
|
Range of Leq 5min |
Range of L10 5min |
Range of L90 5min |
|
|
M1 |
49.3 – 53.2 |
50.2 – 54.9 |
48.4 – 50.4 |
|
M2 |
49.5 – 59.2 |
50.0 – 61.0 |
48.9 – 55.8 |
|
M3 |
49.6 – 56.9 |
52.3 – 57.6 |
48.9 – 56.4 |
Table 3.8 Summary of Additional Impact Noise Monitoring Results during Night Time (2300 – 0700 hours)
|
Location |
Measured Noise Level in dB(A) |
||
|
Range of Leq 5min |
Range of L10 5min |
Range of L90 5min |
|
|
M1 |
45.1 – 49.9 |
45.6 – 50.8 |
44.3 – 48.8 |
|
M2 |
47.1 – 59.4 |
47.5 – 62.7 |
46.8 – 54.1 |
|
M3 |
44.9 – 57.0 |
48.4 – 58.0 |
43.9 – 56.3 |
Table 4.1 Quantities of Waste Generated from the Project during October 2025
|
Actual Quantities of Inert C&D Materials Generated Monthly |
Actual Quantities of C&D Wastes Generated Monthly |
|||||||||||||
|
Total Quantity Generated |
Hard Rock and Large Broken Concrete (see Note 1) |
Reused in the Contract |
Reused in other Projects |
Disposed as Public Fill |
Imported Fill |
Metals |
Paper / cardboard packaging |
Plastics (see Note 2) |
Chemical Waste |
Others, e.g. general refuse (see Note 3) |
||||
|
Sand |
Public Fill |
Rock |
||||||||||||
|
(in ,000m3) |
(in ,000m3) |
(in ,000m3) |
(in ,000m3) |
(in ,000m3) |
(in ,000m3) |
(in ,000kg) |
(in ,000kg) |
(in ,000kg) |
(in ,000kg) |
(in ,000L) |
(in ,000m3) |
|||
|
Oct 2025 |
1.4553 |
0 |
0 |
0 |
1.4553 |
0 |
0 |
0 |
0 |
0.4450 |
0 |
0 |
0 |
0.6175 |
Notes: (1) Broken concrete for recycling into aggregates.
(2) Plastics refer to plastic bottles/ containers, plastic sheets/ foam from packaging materials.
(3) Use the conversion factor: 1 full load of dumping truck being equivalent to 6.5m3 by volume.
(4) Use the conversion factor: rock density = 2 T/m3.
Table 5.1 Tagged Coral Monitoring Locations, Time and Frequency
|
Monitoring Location |
Monitoring Month/Year |
Frequency |
No. of Monitoring Survey |
|
10 selected hard coral colonies at control site / indirect impact site |
1st Month |
Weekly Survey |
4 |
|
2nd to 3rd Months |
Monthly Survey |
2 |
|
|
4th Month (postponed to 5th month due to diver accident in Shek Kwu Chau in October 2018) |
Re-tagging of Coral Colonies in Indirect Impact Site after Typhoon Mangkhut |
||
|
4th Month (postponed to 5th month due to diver accident in Shek Kwu Chau in October 2018 and further postpone to 6th month due to adverse weather) |
Re-tagging of Coral Colonies in Control Site after Typhoon Mangkhut |
||
|
5th Month (postponed to 6th month due to diver accident in Shek Kwu Chau and further postponed to 7th month due to delay of re-tagging activities at both Indirect Impact Site and Control Site) |
Post Re-tagging Monthly Survey |
1 |
|
|
7th to 96th Months (postponed to 8th to 97th month due to diver accident in Shek Kwu Chau in October 2018) |
Quarterly Survey |
28 |
|
|
97th to 99th Months (The marine construction work is anticipated to be completed by June 2026, the frequency of monitoring will be changed to bi-annual with reference to the Updated EM&A Manual (Rev.E) ) |
Bi-annually Survey |
1
|
|
|
16 translocated hard coral colonies and 10 selected natural hard coral colonies at recipient site R3 |
1st Year |
Quarterly Survey |
4 |
|
|
||
|
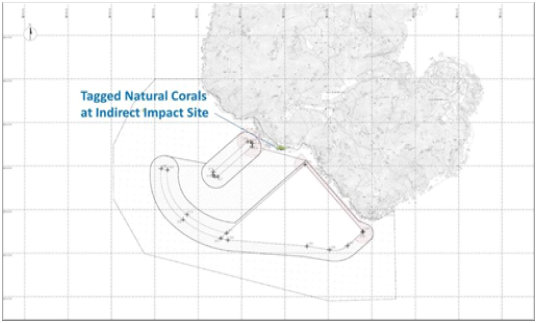
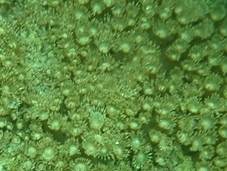
Figure 5.1 Tagged Natural Corals at Indirect Impact Site Near SKC for re-tagging after typhoon Mangkhut |
||
|
N |
||
|
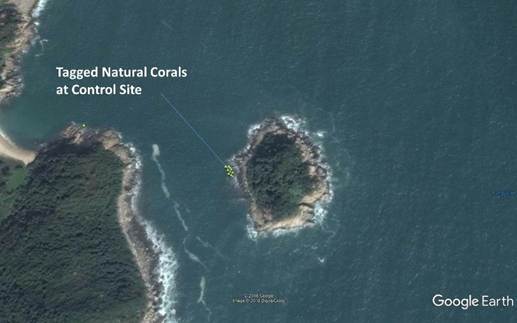
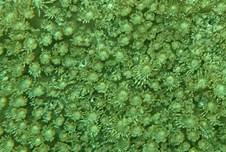
Figure 5.2 Tagged Natural Corals at Control Site Near Yuen Kong Chau for re-tagging after typhoon Mangkhut |
||
|
|
||
|
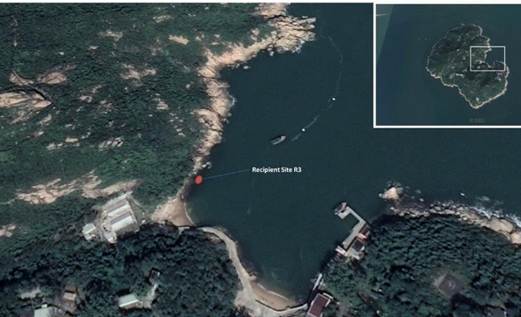
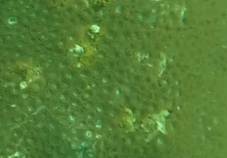
Figure 5.3 Tagged Translocation Corals at Recipient Site R3 near SKC |
Table 5.2 Tagged Natural Corals during Baseline and Re-tagged Natural Corals after Typhoon Manghkut at Control Site near Yuen Long Chau
|
Coral # |
GPS Coordinates |
|
|
1 |
N22°09’45.96” |
E113°54’57.81” |
|
2R |
N22°11’29.12” |
E113°59’09.01” |
|
3 |
N22°09’45.81” |
E113°54’57.78” |
|
4 |
N22°09’45.70” |
E113°54’57.95” |
|
5R |
N22°11’29.10” |
E113°59’09.18” |
|
6 |
N22°09’45.75” |
E113°54’58.02” |
|
7R |
N22°11’29.17” |
E113°59’08.86” |
|
7 |
N22°09’45.65” |
E113°54’57.94” |
|
8 |
N22°09’45.53” |
E113°54’57.90” |
|
9 |
N22°09’46.23” |
E113°54’54.70” |
|
10R |
N22°11’29.18” |
E113°59’08.91” |
Notes:
i. The re-tagged corals were marked as ##R.
Table 5.3 Re-tagged Natural Corals after Typhoon Manghkut at Indirect Impact Site near SKC
|
Coral # note i |
GPS Coordinates |
|
|
11R |
N22°11’29.14” |
E113°59’08.92” |
|
12R |
N22°11’29.12” |
E113°59’09.01” |
|
13R |
N22°11’29.11” |
E113°59’09.07” |
|
14R |
N22°11’29.13” |
E113°59’09.12” |
|
15R |
N22°11’29.10” |
E113°59’09.18” |
|
16R |
N22°11’29.07” |
E113°59’09.23” |
|
17R |
N22°11’29.17” |
E113°59’08.86” |
|
18R |
N22°11’29.14” |
E113°59’08.94” |
|
19R |
N22°11’29.20” |
E113°59’08.81” |
|
20R |
N22°11’29.18” |
E113°59’08.91” |
Notes:
i. The re-tagged corals were marked as ##R.
Table 5.4 GPS Coordinates of Recipient Site R3
|
Site |
GPS Coordinates |
|
|
R3 |
N22°11’43.69” |
E113°28.99” |
5.4 Impact Monitoring Methodology 5.4.1 Health status of coral was assessed by the following criteria:
· Hard coral: Percentage of surface area exhibiting partial mortality and blanched/bleached area of each coral colony and degree of sedimentation.
5.5 Action and Limit Levels 5.5.1 Monitoring result was reviewed and compared against the below Action Level and Limit Level (AL/LL) as set with the below Table 5.5 and Table 5.6.Table 5.5 Action and Limit Levels for Construction Phase Coral Monitoring
|
Parameter |
Action Level |
Limit Level |
|
Mortality |
If during Impact Monitoring a 15% increase in the percentage of partial mortality on the corals occurs at more than 20% of the tagged indirect impact site coral colonies that is not recorded on the tagged corals at the control site, then the Action Level is exceeded. |
If during Impact Monitoring a 25% increase in the percentage of partial mortality on the corals occurs at more than 20% of the tagged indirect impact site coral colonies that is not recorded on the tagged corals at the control site, then the Limit Level is exceeded. |
Table 5.6 Action and Limit Levels for Post-Translocation Coral Monitoring
|
Parameter |
Action Level |
Limit Level |
|
Mortality |
If during Post-Translocation Monitoring a 15% increase in the percentage of partial mortality on the corals occurs at more than 20% of the translocated coral colonies that is not recorded on the original corals in the recipient site, then the Action Level is exceeded. |
If during Post-Translocation Monitoring a 25% increase in the percentage of partial mortality on the corals occurs at more than 20% of the translocated coral colonies that is not recorded on the original corals in the recipient site, then the Limit Level is exceeded. |
Table 5.5 Action and Limit Levels for Construction Phase Coral Monitoring
|
Parameter |
Action Level |
Limit Level |
|
Mortality |
If during Impact Monitoring a 15% increase in the percentage of partial mortality on the corals occurs at more than 20% of the tagged indirect impact site coral colonies that is not recorded on the tagged corals at the control site, then the Action Level is exceeded. |
If during Impact Monitoring a 25% increase in the percentage of partial mortality on the corals occurs at more than 20% of the tagged indirect impact site coral colonies that is not recorded on the tagged corals at the control site, then the Limit Level is exceeded. |
Table 5.6 Action and Limit Levels for Post-Translocation Coral Monitoring
|
Parameter |
Action Level |
Limit Level |
|
Mortality |
If during Post-Translocation Monitoring a 15% increase in the percentage of partial mortality on the corals occurs at more than 20% of the translocated coral colonies that is not recorded on the original corals in the recipient site, then the Action Level is exceeded. |
If during Post-Translocation Monitoring a 25% increase in the percentage of partial mortality on the corals occurs at more than 20% of the translocated coral colonies that is not recorded on the original corals in the recipient site, then the Limit Level is exceeded. |
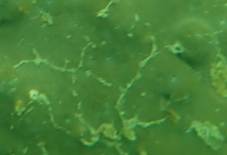
Table 5.7 Weather Condition for the 27th Quarterly Coral Monitoring during Construction Phase at both Indirect Impact Site and Control Site
|
Condition |
Average Underwater Visibility |
|
|
2 October 2025 |
- East wind force 4 to 5 - Sunny Day |
- Less than 20 cm |
Table 5.8 Sizes, Condition, Mortality, Bleaching and Sediment of 10 Natural Coral Colonies at Control Site during 27th Quarterly Coral Monitoring
|
Tag # |
Species |
Size (cm) – Max. Diameter |
Condition |
Mortality (%) |
Bleaching (%) |
Sediment (%) |
|||
|
Baseline |
2/10 |
Baseline |
2/10 |
Baseline |
2/10 |
||||
|
1 |
Goniopora stutchburyi |
25 |
Good |
0 |
0 |
0 |
0 |
0 |
0 |
|
2R |
Goniopora stutchburyi |
10 |
Good |
0 |
0 |
0 |
0 |
0 |
0 |
|
3 |
Psammocora superficialis |
18 |
Good |
0 |
0 |
0 |
0 |
0 |
0 |
|
4 |
Turbinaria peltata |
13 |
Good |
0 |
0 |
0 |
0 |
0 |
0 |
|
5R |
Goniopora stutchburyi |
18 |
Good |
0 |
0 |
0 |
0 |
0 |
0 |
|
6 |
Cyphastrea serailia |
43 |
Good |
0 |
0 |
0 |
0 |
0 |
0 |
|
7R |
Coscinaraea sp. |
15 |
Good |
0 |
0 |
0 |
0 |
0 |
0 |
|
8 |
Goniopora stutchburyi |
21 |
Good |
0 |
0 |
0 |
0 |
0 |
0 |
|
9 |
Goniopora stutchburyi |
11 |
Good |
0 |
0 |
0 |
0 |
0 |
0 |
|
10R |
Goniopora stutchburyi |
20 |
Good |
0 |
0 |
0 |
0 |
0 |
0 |
Notes:
i. The re-tagged corals were marked as ##R.
Table 5.9 Sizes, Condition, Mortality, Bleaching and Sediment of 10 Natural Coral Colonies at Indirect Impact Site during 27th Quarterly Coral Monitoring
|
Tag # |
Species |
Size (cm) – Max. Diameter |
Condition |
Mortality (%) |
Bleaching (%) |
Sediment (%) |
|||
|
Baseline |
2/10 |
Baseline |
2/10 |
Baseline |
2/10 |
||||
|
11R |
Cyphastrea serailia |
48 |
Good |
0 |
0 |
0 |
0 |
0 |
0 |
|
12R |
Favites chinensis |
27 |
Good |
0 |
0 |
0 |
0 |
0 |
0 |
|
13R |
Turbinaria peltata |
21 |
Good |
0 |
0 |
0 |
0 |
0 |
0 |
|
14R |
Favites chinensis |
8 |
Good |
0 |
0 |
0 |
0 |
0 |
0 |
|
15R |
Goniopora stutchburyi |
11 |
Good |
0 |
0 |
0 |
0 |
0 |
0 |
|
16R |
Psammocora superficialis |
27 |
Good |
0 |
0 |
0 |
0 |
0 |
0 |
|
17R |
Favites chinensis |
15 |
Good |
0 |
0 |
0 |
0 |
0 |
0 |
|
18R |
Psammocora superficialis |
39 |
Good |
0 |
0 |
0 |
0 |
0 |
0 |
|
19R |
Psammocora superficialis |
42 |
Good |
0 |
0 |
0 |
0 |
0 |
0 |
|
20R |
Psammocora superficialis |
29 |
Good |
0 |
0 |
0 |
0 |
0 |
0 |
Notes:
i. The re-tagged corals were marked as ##R.
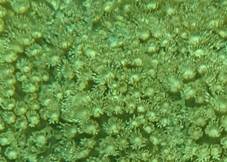
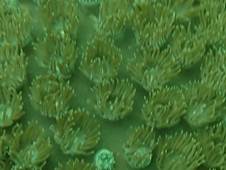
Photo Plate 5.1 Ten (10) Monitored Corals at Control Site
|
Tag # |
2 October 2025 |
|
#1 |
Goniopora stutchburyi |
|
#2R |
Goniopora stutchburyi |
|
#3 |
Psammocora superficialis |
|
#4 |
Turbinaria peltata |
|
#5R |
Goniopora stutchburyi |
|
#6 |
Cyphastrea serailia |
|
#7R |
Coscinaraea sp. |
|
#8 |
Goniopora stutchburyi |
|
#9 |
Goniopora stutchburyi |
|
#10R |
Goniopora stutchburyi |
Notes:
i. The re-tagged corals were marked as ##R.
Photo Plate 5.2 Ten (10) Monitored Corals at Indirect Impact Site
|
Tag # |
2 October 2025 |
|
#11R |
Cyphastrea serailia |
|
#12R |
Favites chinensis |
|
#13R |
Turbinaria peltata |
|
#14R |
Favites chinensis |
|
#15R |
Goniopora stutchburyi |
|
#16R |
Psammocora superficialis |
|
#17R |
Favites chinensis |
|
#18R |
Psammocora superficialis |
|
#19R |
Psammocora superficialis |
|
#20R |
Psammocora superficialis |
Notes:
i. The re-tagged corals were marked as ##R.
5.7.3 The coral re-tagging activities were carried out in the control site and indirect impact area on 23 November and 3 December 2018. Four and ten hard coral colonies were successfully re-tagged at both control and indirect impact sites respectively. Each re-tagged and remained coral colonies were photographed. 5.7.4 All tagged and re-tagged coral colonies showed good health condition during the 27th Quarterly Construction Phase Monitoring. There was no increased level of mortality, bleaching and sediment when compared with the baseline results. 5.7.5 No sediment, bleaching or increased mortality in the general condition of coral colonies were observed during the tenth construction phase monitoring period. No deterioration of the coral community was observed in the ecological monitoring results when compared with the baseline ecological monitoring results. There is no AL/LL exceedance during the monitoring period. Photos of each tagged corals colonies were taken and shown in Photo Plates 5.1 and Photo Plate 5.2.
6. Marine Mammal
6.1 Monitoring Requirements 6.1.1 The marine mammal monitoring programme would focus on Finless Porpoise, as the study area near Shek Kwu Chau has been identified as a hotspot for this species, while the Chinese White Dolphins rarely occurred there in the past. 6.1.2 The monitoring will verify the predicted impacts on marine mammals and examine whether the mitigation measures recommended in the EIA report have been effectively implemented to protect marine mammals from negative impacts from construction activities. 6.1.3 The Vessel-based Line-transect Survey, the Passive Acoustic Monitoring and the Land-based Theodolite Tracking will be conducted to provide systematic, quantitative measurements of occurrence, encounter rate, habitat use, movement and behavioural patterns of marine mammals within or near the Project Area during construction and operational phases. 6.1.4 The mammal monitoring works during construction consist of the following three survey methods:· Vessel-based Line-transect Survey – to monitor the occurrence of Finless Porpoises (and Chinese White Dolphins) in the study area during construction works, by comparing with the findings of the pre-construction marine mammal monitoring;
· Passive Acoustic Monitoring – to study the usage of the Project Area and two control sites in South Lantau Waters by Finless Porpoise during construction works, in reference with the baseline findings of the pre-construction marine mammal monitoring; and
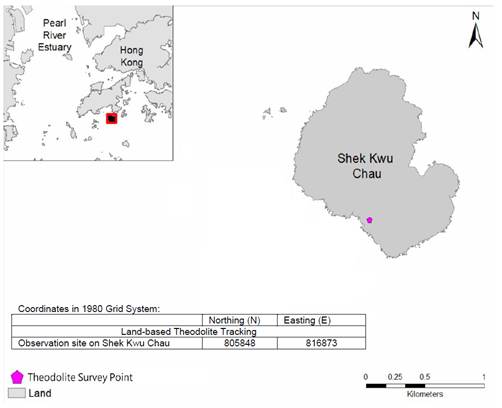
· Land-based Theodolite Tracking – to study the movement and behavioral pattern of Finless Porpoise within and around the Project Area during construction works.
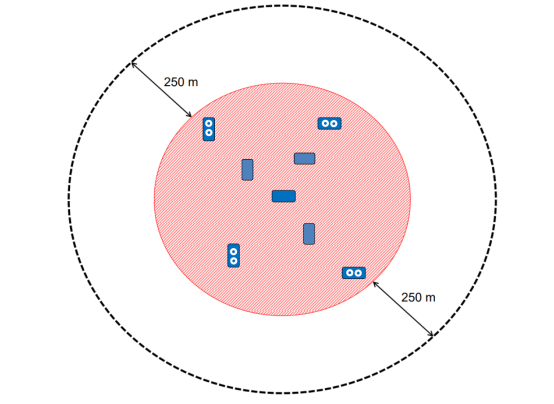
6.1.5 The marine mammal observation works of Marine Mammal Exclusion Zone (MMEZ) and Marine Mammal Watching as two of the specific mitigation measures recommended in the approved EIA report shall be fully and properly implemented for the Project to minimize disturbance on Finless Porpoise during construction and operational phases. 6.2 Survey Methods 6.2.1 Vessel-based Line-transect Survey6.2.1.1 For the vessel-based marine mammal surveys, the monitoring team adopted the standard line-transect method (Buckland et al. 2001) as same as that adopted during the EIA study and pre-construction phase monitoring to allow fair comparison of marine mammal monitoring results.
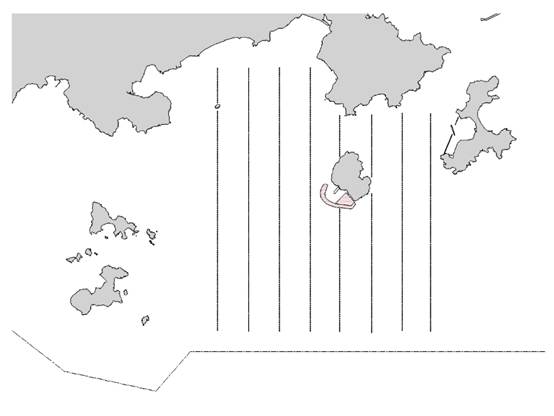
6.2.1.2 Eight transect lines are set at Southeast Lantau survey area, including Shek Kwu Chau, waters between Shek Kwu Chau and the Soko Islands, inshore waters of Lantau Island (e.g. Pui O Wan) as well as southwest corner of Cheung Chau as shown in Figure 6.1 below:
|
|
Figure 6.1 Line Transects for Marine Mammal Surveys |
6.2.1.3 The surveys should cover all 4 seasons in order to take natural fluctuation and seasonal variations into account for data analysis of distribution, encounter rate, density and habitat use of both porpoises and dolphins (if any). In comparison to the baseline monitoring results, results from the analysed construction phase monitoring data would allow the detection of any changes of their usage of habitat, in response to the scheduled construction works. The monitoring surveys shall be conducted throughout the construction phase involving marine construction work with the frequency shown in Table 6.1 below:
Table 6.1 Vessel-based Line-transect Survey Frequency
|
Season |
Months |
Frequency |
|
Peak Season |
December, January, February, March, April & May |
Twice per month |
|
Non-peak Season |
June, July, August, September, October & November |
Once per month |
6.2.1.4 For each vessel survey, a 15-m inboard vessel with an open upper deck (about 4.5 m above water surface) would be used to make observations from the flying bridge area. Two experienced marine mammal observers (a data recorder and a primary observer) would make up the on-effort survey team, and the survey vessel would transit different transect lines at a constant speed of 13-15 km per hour. The data recorder shall search with unaided eyes and fill out the datasheets, while the primary observer shall search for dolphins and porpoises continuously through 7 x 50 marine binoculars. Both observers shall search the sea ahead of the vessel, between 270o and 90o (in relation to the bow, which is defined as 0°). Two additional experienced observers shall be available on the boat to work in shift (i.e. rotate every 30 minutes) in order to minimize fatigue of the survey team members. All observers shall be experienced in small cetacean survey techniques and identifying local cetacean species with extensive training by marine mammal specialist of the ET.
6.2.1.5 During on-effort survey periods, the survey team shall record effort data including time, position (latitude and longitude), weather conditions (Beaufort sea state and visibility), and distance travelled in each series (a continuous period of search effort) with the assistance of a handheld GPS (Garmin eTrex Legend). Data including time, position and vessel speed would also be automatically and continuously logged by handheld GPS throughout the entire survey for subsequent review.
6.2.1.6 When porpoises or dolphins are sighted, the survey team shall end the survey effort, and immediately record the initial sighting distance and angle of the porpoise or dolphin group from the survey vessel, as well as the sighting time and position. Then the research vessel shall be diverted from its course to approach the animals for species identification, group size estimation, assessment of group composition, behavioural observations, and collection of identification photos (feasible only for Chinese White Dolphin). The perpendicular distance (PSD) of the porpoise or dolphin group to the transect line would then be calculated from the initial sighting distance and angle, which shall be used in the line-transect analysis for density and abundance estimation.
6.2.1.7 The line-transect survey data shall be integrated with a Geographic Information System (GIS) to visualize and interpret different spatial and temporal patterns of porpoise and dolphin distribution using their sighting positions collected from vessel surveys. Location data of porpoise and dolphin groups would be plotted on map layers of Hong Kong using a desktop GIS (e.g. ArcView© 3.1) to examine their distribution patterns in details. The encounter rate could be used as an indicator to determine areas or time periods of importance to porpoises within the study area. For encounter rate analysis of finless porpoises, only survey data collected under Beaufort 2 or below condition would be used for encounter rate analysis.
6.2.1.8 To take into account of the variations of survey effort across different sections within survey area, the quantitative grid analysis of habitat use would be conducted to examine finless porpoise usage among 1-km2 grids within the Southeast Lantau survey area. For the grid analysis, SPSE (sighting density) and DPSE (porpoise density) values would be deduced for evaluation on level of porpoise usage. First, positions of on-effort porpoise sightings from the study period are plotted onto 68 grids (1 km x 1 km each) within the survey area. Sighting density grids and porpoise density grids shall then be normalized with the amount of survey effort conducted within each grid. The total amount of survey effort spent on each grid shall be calculated by examining the survey coverage on each line-transect survey to determine how many times the grid had been surveyed during study period. With the amount of survey effort calculated for each grid, the sighting density and porpoise density of each grid shall be further normalized (i.e. divided by the unit of survey effort).
6.2.1.9 The newly-derived unit for sighting density was termed SPSE, representing the number of on-effort sightings per 100 units of survey effort. In addition, the derived unit for actual porpoise density was termed DPSE, representing the number of dolphins/porpoise per 100 units of survey effort. Among the 1-km2 grids that were partially covered by land, the percentage of sea area was calculated using GIS tools, and their SPSE and DPSE values were adjusted accordingly. The following formulae shall be used to estimate SPSE and DPSE in each 1-km2 grid within the study area:
SPSE = ((S / E) x 100) / SA%
DPSE = ((D / E) x 100) / SA%
where S = total number of on-effort sightings
D = total number of dolphins/porpoises from on-effort sightings
E = total number of units of survey effort
SA% = percentage of sea area
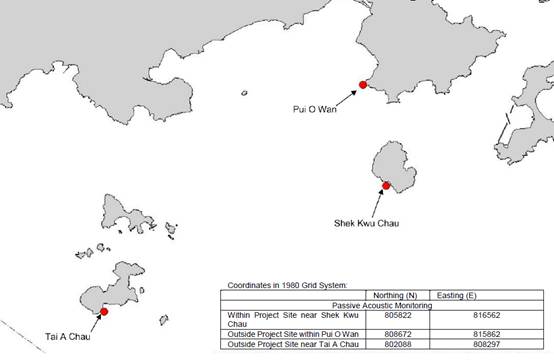
6.2.2 Passive Acoustic Monitoring (PAM)The PAM aims to study the usage of an area by Finless Porpoise by using an array of automated static porpoise detectors (e.g. C-POD) which would be deployed at different locations to detect the unique ultra-high frequency sounds produced by Finless Porpoise. During the construction period, the PAM survey will be conducted including placement of two passive porpoise detectors outside the Project Area as control site (i.e. within Pui O Wan and to the south of Tai A Chau) and one porpoise detector within the Project Area (i.e. near Shek Kwu Chau) as shown in Figure 6.2 below.
|
Table 6.2 PAM Deployment Period
|
Season |
Months |
Deployment Period |
|
Peak Season |
December, January, February, March, April or May |
At least 30 days during the peak months of porpoise occurrence in South Lantau waters |
6.2.3.1 The automated static porpoise detectors shall detect the presence and number of finless porpoise and Chinese White Dolphins respectively over the deployment period, with the false signal such as boat sonar and sediment transport noise distinguished and filtered out. The detectors shall be deployed and retrieved by professional dive team on the seabed of the three selected location shown in Figure 6.2. During each deployment, the C-POD unit serial numbers as well as the time and date of deployments shall be recorded. Information including the GPS positions and water depth at each of the deployment locations shall also be obtained.
6.2.3.2 The diel patterns (i.e. 24-hour activity pattern) of finless porpoise occurrence among the three sites at Shek Kwu Chau, Tai A Chau and Pui O Wan shall be analyzed. Peaks and troughs of finless porpoise occurrence per hour of day would be identified and compared with the results obtained from pre-construction monitoring.
6.2.4 Land-based Theodolite Tracking6.2.4.1 The Land-based Theodolite Tracking study would use the same station as in the AFCD monitoring study (same as the baseline monitoring location), which is situated at the southwest side of Shek Kwu Chau (GPS position: 22o11.47’ N and 113o59.33’ E) as shown in below Figure 6.3. The station was selected based on its height above sea level (at least 20 metres), close proximity to shore, and relatively unobstructed views of the entire Project Area to the southwest of Shek Kwu Chau. The height of the Shek Kwu Chau Station established by the HKCRP team is 74.6 m high at mean low water, and only a few hundred metres to the IWMF reclamation site, which is ideal for the purpose for the present behavioural and movement monitoring of finless porpoises as well during construction phase considering there as an un-obstructed vantage point at a height above the Project Site.
|
|
Figure 6.3 Locations of Land-based Theodolite Tracking |
Table 6.3 Land-based Theodolite Tracking Survey Period
|
Season |
Months |
Survey Period |
|
Peak Season |
December, January, February, March, April or May |
30 days during the peak months of porpoise occurrence in South Lantau waters |
6.2.4.2 The monitoring period for land-based theodolite tracking will be proposed to be overlapped with the PAM. The monitoring team consists of one experienced theodolite operator and at least two field observers for assistance. To conduct theodolite tracking, the observers will search systematically for Finless Porpoise using the unaided eye and 7 x 50 handheld binoculars on each survey day throughout the study area. When an individual or group of porpoises is located, a theodolite tracking session will be initiated and focal follow methods will be used to track the porpoise(s). Behavioural state data (i.e. resting, milling, travelling, feeding and socializing) shall also be recorded every 5 minutes for the focal individual or group. Positions of porpoises and boats shall be measured using a digital theodolite connected to a laptop computer. This tracking survey was conducted during the peak season between December 2018 and May 2019 for 30 surveys spanning across 15-16 weeks during the peak season to provide good temporal coverage during the initial stage of the construction period.
6.3 Specific Mitigation Measures 6.3.1 Monitored exclusion zones6.3.1.1 A MMEZ with 250 m distance from silt curtain shall be established during the above situation. If 3 or more construction vessels are required with MMO’s duty and operating in close proximity, for the purpose of avoiding accidental entrance to the works area by Marine Mammal, a cluster MMEZ plan will be implemented to form a MMEZ with 250 m distance from the boundary of a work area as indicated in Figure 1 for reference. A team of MMO (i.e. at least two MMOs per day/night shift teams) would be arranged at the out-lying construction vessels to form the cluster MMEZ. The MMEZ serves as a monitoring approach to provide appropriate and immediate actions once finless porpoise or Chinese White Dolphin is sighted within the MMEZ. All MMEZ will be monitored by competent Marine Mammal Observers (MMOs) to be provided by the Environmental Team for the IWMF and trained by the Marine Mammal Monitoring Specialist of the ET who is independent from KSZHJV. The marine mammal observer(s) shall be independent of the construction contractor and shall form part of the Environmental Team and have the power to call-off construction activities.
6.3.1.2 According to the Condition 2.25 of the FEP, MMEZ should be implemented during the installation/re-installation/relocation process of floating type silt curtains in order to avoid the accidental entrance and entrapment of marine mammals within the silt curtains. Also, marine construction works expected to produce underwater acoustic disturbance as per Condition 2.27 of the FEP, especially within December and May, would require the implementation of MMEZ, which currently all those specific construction activities have been replaced by less acoustically disturbing construction methods such as Deep Cement Mixing (DCM) and Precast Concrete Blocks Installation as discussed in Section 5.3 of the Detailed Monitoring Programme on Finless Porpoise, however, MMEZ would also be implemented for precautionary purpose for DCM works.
6.3.1.3 A MMEZ with 250 m distance from the boundary of a work area shall be established during the above situation. A typical MMEZ is indicated in Figure 6.4 for reference. The MMEZ serves as a monitoring approach to provide appropriate and immediate actions once finless porpoise or Chinese White Dolphin is sighted within the MMEZ. All MMEZ will be monitored by competent Marine Mammal Observers (MMOs) to be provided by the Environmental Team (ET) for the IWMF and trained by the Marine Mammal Monitoring Specialist of the ET who is independent from KSZHJV.
|
|
|
|
Figure 6.4 Illustration of Typical MMEZ |
6.3.1.4 Prior to the commencement of construction activity, our MMOs shall ensure the boundary of a marine work area and setting up of the MMEZ for the work area and get access to the monitoring location on a barge or a lookout point where there is no obstructed views for monitoring the MMEZ during the construction activity. The MMEZ shall be scanned thoroughly by a MMO for any presence of marine mammal e.g. finless porpoise for an initial period of 30 minutes. Construction activity shall only be commenced after the MMO has confirmed that the MMEZ is clear of the marine mammal for the initial period of 30 minutes. The MMO shall then inform the construction superintendent through mobile phone or handheld transceivers to certify the commencement of construction activity. The MMEZ monitoring shall be carried on throughout the period for all active construction activities requiring implementation of MMEZ.
6.3.1.5 When any mammal marine, e.g. Finless Porpoise, is detected by the MMO within the MMEZ during construction, the MMO shall inform the construction superintendent immediately through mobile phone or handheld transceivers to cease construction activity within the MMEZ. Construction activity shall not be re-commenced until the MMO confirms that the MMEZ is continuously clear of marine mammal for a period of 30 minutes. The MMO shall then inform the construction superintendent through mobile phone or handheld transceivers to certify the re-commencement of construction activity.
6.3.1.6 As there could be a number of Contractors working at the same time within a work area for the IWMF project, a full contact list of MMEZ monitoring team members of the ET and the relevant responsible construction superintendents of the Contractor at the site shall be prepared, updated regularly and circulated to all parties involved in the MMEZ monitoring. With a full contact list, our MMOs shall be able to find out the contacts of corresponding persons in case of marine mammal sighting within and near the MMEZ or emergent occurrence of any unpredictable impact on marine mammal.
6.3.1.7 If a marine mammal is still observed in close vicinity but outside the MMEZ, the MMO shall inform the construction superintendent about the presence of marine mammal. The MMO shall remain in position and closely observe the movement of the marine mammal as well as searching for the appearance of any other marine mammal within the MMEZ. No matter the marine mammal is observed within or in close vicinity but outside the MMEZ, the construction superintendent or relevant persons shall inform all vessel captains involved in construction activities around the MMEZ to pay special attention of the presence of the marine mammal in order to reduce chance of collision with them. In case of injury or live-stranded marine mammal being found within the MMEZ, the marine mammal observer shall immediately inform the construction superintendent to suspend construction activities within the works area and contact AFCD through “1823” marine mammal stranding hotline.
6.3.2 Marine mammal watching plan6.3.2.1 Upon the completion of silt curtain installation/re-installation/relocation, the marine works would be conducted within an enclosed environment within the silt curtain. Subsequently, Visual Inspection of the Waters Surrounded by Silt Curtains (Section 2.1, MMWP) and Regular Inspection of Deployed Silt Curtain (Section 2.2, MMWP) inspection under Marine Mammal Watching Plan would be implemented (where applicable, Marine Mammal Exclusion Zone shall be conducted at the meantime).
6.3.2.2 Before commencement of dredging/sand blanket laying work at each designated area, a trained MMO shall check whether position frame silt curtains are ready, well prepared and operated without any obvious damage. Also, the MMO shall confirm the presence of the relevant frontline staff of the main contractor or its sub-contractors and engineers on board to ensure the effective communication, coordination and implementation of the response plan in relation to any incidents involving marine mammals within the waters surrounded by the position frame type silt curtains and the work areas. Also, there are lookout points at an elevated level on each barge, clear and safe access at the edges of the derrick lighter/ flag-top barge for inspection during dredging/sand blanket laying works, provision of sufficient lighting is required if working at night.
6.3.2.3 During the operation, the inspection will be conducted daily. The MMO will walk along the edge of derrick lighter (DL) and flag-top barge (FB) along the position frame silt curtain or proper location without obstacles where appropriate to inspect the position frame silt curtain with naked eyes, the MMO will check that the position frame silt curtains are maintained in the correct positions with no obvious defects / entanglement and there is no observable muddy water passing through the position frame silt curtain system. Any floating refuse trapped by the silt curtain shall be removed as part of the regular inspection. For night inspection, spotlight will be used to provide sufficient brightness to assist the inspection in dark condition.
6.3.2.4 For the re-deployment of the localized silt curtains (frame-type, cage-type or enclosed floating-type silt curtains), MMO will conduct visual inspection to confirm that there is no presence of marine mammal within the localized silt curtains (frame-type, cage-type or enclosed floating-type silt curtains). Visual inspection will be conducted every hour by MMO for confirming that there is no marine mammal observed in the surrounding area of the deployed silt curtain during re-deployment of localized silt curtains (frame-type, cage-type or enclosed floating-type silt curtains). The duration will be subject to various conditions, e.g. weather or angle of observation. The works can only commence after confirming that the surrounding waters of the localized silt curtains do not contain any marine mammal. Thereafter, frontline staff, i.e. foremen, site agent, superintendents and engineers will assist our MMO in implementing the plan from the active work fronts within the waters surrounded by the silt curtains throughout the work period. The MMO will conduct regular check to observe the presence of any marine mammal around the localized silt curtain or being trapped by the localized silt curtain daily. The MMOs will also check if the localized silt curtains are in correct positions.
6.3.2.5 The MMO shall fill up our Marine Mammal Sighting Record Sheet. After inspection, those records should be kept properly and submitted to the project team. In case there is any marine mammal being found, the MMO should carry out the response actions and communicate with relevant parties to stop and then resume work after the discovered marine mammal leaves. After lifting up and mobilization of silt curtain, the MMO will repeat the procedures of regular and visual inspection until the end of the construction works.
6.3.2.6 Each lookout point will have an unobstructed view to waters around the DL and FB. The MMO will move around the DL and FB to establish a clear and unobstructed view as much as they can without compromising the safety concern. When appropriate, the lookout point can be replaced by a proper location if unobstructed view can be assured.
6.3.2.7 Installation of caisson No.19 was completed on 18 March 2021, which the reclamation area had been totally enclosed by permanent structure. Floating type silt curtain at marine access was removed on 18 March 2021. No enclosed area shall be formed by deployment of silt curtain for the remaining works programme.
6.4 Results and Observations 6.4.1 Vessel-based Line-transect Survey6.4.1.1 As confirmed with Contractor, no marine construction work will be carried out from December 2025 to June 2025 tentatively. EPD advised no objection on the temporary suspension of water quality and line-transect monitoring on 25 February 2025. The line-transect monitoring was then temporarily suspended from 25 February 2025 onward.
6.4.2 PAM and Land-based Theodolite Tracking6.4.2.1 30 days of PAM surveys were started on 1 May 2019 and completed in the end of May 2019. Multiple PAM systems were deployed at three sites. The PAM system located at the IWMF was lost, however, an alternative data set had been identified. The PAM systems at the two control sites Tai A Chau and Pui O were recovered on 3 August 2019. A summary of marine mammal detections showed that porpoise were recorded every day of deployment at each site, but at varying frequencies. The detailed theodolite result was presented in 17th Monthly EM&A report (November 2019) while detailed PAM result was presented in 18th Monthly EM&A report (December 2019).
6.4.2.2 For the baseline study, the Detection Positive Minutes (DPM) for each site was 11,160 (Shek Kwu Chau), 16,089 (Tai A Chau) and 3645 (Pui O Wan), totalling 30,894 DPM across all three sites, compared to DPMs of 4740 (Shek Kwu Chau), 7725 (Tai A Chau) and 23,986 (Pui O Wan), totalling 36,451 DPM, for the impact phase study. As the impact phase study was longer than the baseline study, it is not appropriate to directly compare total counts of DPM. However, the DPM rate (the average number of detections per day) for each site can be more directly compared. During the baseline study, Shek Kwu Chau averaged 338.2 DPM per day compared with 124.8 DPM per day during the impact phase study. This showed a decrease in the daily average of porpoise detection at Shek Kwu Chau. During the baseline study, Tai A Chau averaged 487.6 DPM per day compared with 179.7 DPM per day, during the impact phase study. This showed a decrease in the daily average of porpoise detection at Tai A Chau. During the baseline study, Pui O Wan averaged 98.5 DPM per day compared with 557.8 DPM per day during the impact phase study. This showed a significant increase in the daily average of porpoise detections at Pui O Wan.
6.4.2.3 Overall, the PAM study showed that porpoise continue to consistently utilise the Shek Kwu Chau habitat immediately adjacent to the IWMF construction activities, although to a lesser degree than that prior to construction activities. In addition, the Pui O Wan site, which is 2.5 km away from the IWMF construction area, was also consistently utilised during the impact phase PAM study. A continued assessment of fine scale habitat use, particularly through PAM which yielded large quantities of data, would allow a more comprehensive assessment of the EIA predictions.
6.4.2.4 Theodolite surveys were completed in May 2019. In total, 34 days of theodolite tracking were completed between February and May 2019, comprising 167 hours and 49 minutes of observation. No Chinese white dolphin was observed and only one finless was recorded. The finless porpoise encounter rate was calculated as 0.006 finless porpoise per hour, in all weather conditions.
6.4.2.5 A total of 2620 vessels of ten different types were observed and tracked within or in the proximity of the IWMF construction site. These comprised fishing boats (236), speed boats (29), container boats (155), government boats (22), high speed ferries (53), others (13) and IWMF-Related construction platforms (974), tug boats (240), transportation boats (363), construction boats (531) and approximately 8 buoys were present marking the site boundary.
6.4.2.6 The baseline theodolite tracking was conducted immediately prior to and during the site preparation activities of the site. The baseline data records a decrease in porpoise sightings as site preparation activities commenced and notes that the decrease was most likely due to the onset of site preparation activities. The impact theodolite tracking conducted for this study records a marked increase in the number of Project related vessels and platforms and, in agreement with baseline conclusions, shows a concomitant decrease in finless porpoise sightings.
6.4.3 Specific Mitigation Measures6.4.3.1 Trainings for the MMO were provided by the ET prior to the monitoring of the Marine Mammal Exclusion Zone (MMEZ) for installation/ re-installation/ relocation process of silt curtains, with a cumulative total of 98 individuals being trained and the training records kept by the ET.
Table 7.1 List of Equipment Used during Construction Phase Monitoring
|
Equipment |
Quantity |
|
Swarovski EL 8.5 x 42 Binocular |
1 |
|
Swarovski EL Range 8 x 42 Binocular |
1 |
|
Swarovski ATX 25-60 x 85 Spotting Scope |
1 |
|
Canon 1Dx Mark II Camera |
1 |
|
Canon EF300mm F2.8 Lens with Canon 2x Teleconverter |
1 |
|
Canon PowerShot G7X Camera |
1 |
|
Garmin GPSMAP 64S |
1 |
Table 7.2 Weather Conditions during the WBSE Monitoring
|
Date |
Condition |
Temperature (℃) |
|
28 October 2025 |
- Northeast wind force 4 to 5 - Sunny |
29 |
|
|
Figure 7.1 Location of WBSE Nests on SKC |
|
|
||
|
One WBSE adult was recorded on 28 October 2025 |
8. Summary of Monitoring Exceedance, Complaints, Notification of Summons and Prosecutions
8.1 The Environmental Complaint Handling Procedure is shown in Figure 8.1.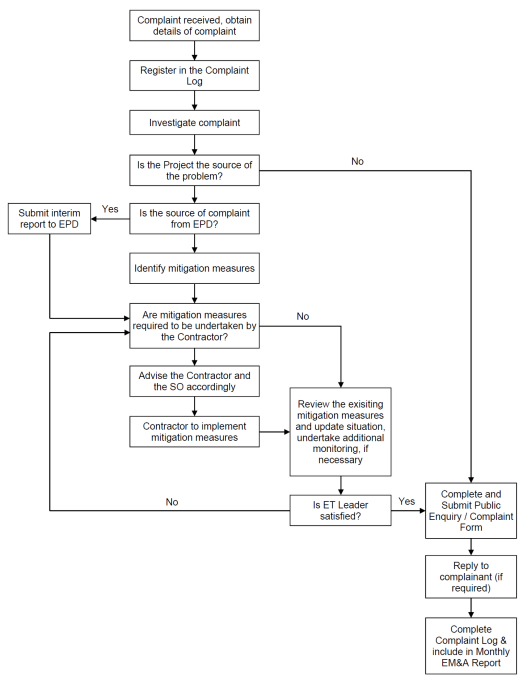
Figure 8.1 Environmental Complaint Handling Procedures
8.2 No exceedance of the Action and Limit Levels of the regular WBSE and noise monitoring was recorded during the reporting period as shown in Appendix K. 8.3 No environmental complaint was received in the reporting period. 8.4 No notification of summons and prosecution was received in the reporting period. 8.5 Statistics on complaints, notifications of summons and successful prosecutions are summarized in Appendix L.
9.1 Site inspections were carried out on a weekly basis to monitor the implementation of proper environmental pollution control and mitigation measures under the Contract. In the reporting period, site inspections were carried out on 9, 14, 22 and 28 October 2025 at the site portions listed in Table 9.1 below.
Table 9.1 Site Inspection Record
|
Date |
Inspected Site Portion |
Time |
|
9 Oct 2025 |
Portion 1, 1A & 1B (near SKC) |
10:45 AM – 11:25 AM |
|
14 Oct 2025 |
Portion 1, 1A & 1B (near SKC) |
10:15 AM – 11:15 AM |
|
22 Oct 2025 |
Portion 1, 1A & 1B (near SKC) |
10:15 AM – 11:15 AM |
|
28 Oct 2025 |
Portion 1, 1A & 1B (near SKC) |
10:20 AM – 11:15 AM |
Table 9.2 Site Observations
|
Environmental Observations |
Follow-up Status |
|
|
9 October 2025 (Site inspection) |
Observation(s) and Recommendation(s)
1. At Seawall B and at petrol station, drip trays should be provided for chemicals.
2. At the vertical seawall, geotextile lining should be deployed properly at the edge of seawall. |
1. At Seawall B and at petrol station, chemicals had been removed and stored in designated area.
2. At the vertical seawall, geotextile lining had been repaired and deployed properly at the edge of seawall. |
|
14 October 2025 (Site inspection) |
Observation(s) and Recommendation(s)
1. At Process Building (+17.5 mPD) and near Process Building, chemical containers were observed without drip trays. Drip trays should be provided to avoid leakage.
2. Near Process Building and CCCW, general waste bins should be kept enclosed and general waste should be removed regularly.
3. At room under the elevated driveway, housekeeping should be enhanced. |
1. At Process Building (+17.5 mPD) and near Process Building, chemical containers had been removed and stored in designated area.
2. Near Process Building and CCCW, general waste had been removed regularly, and bins had been kept enclosed
3. At room under the elevated driveway, general waste had been removed regularly |
|
22 October 2025 (Site inspection) |
Observation(s) and Recommendation(s)
1. Near Process Building, fuel tanks should be placed on drip trays.
2. Outside Process Building, housekeeping should be enhanced.
|
1. Near Process Building, fuel tanks had been removed and stored in designated area.
2. Outside Process Building, general waste and C&D waste had been removed regularly. |
|
28 October 2025 (Site inspection) |
Observation(s) and Recommendation(s)
1. At Seawall B, during loading of C&D waste and dusty material on to the barge, tarpaulin sheets should be deployed between barge and edge of seawall to avoid rubbish entering the sea. Floating refuse should be removed from sea.
2. Near Substation and Seawall A (Caisson 73), housekeeping should be enhanced.
3. At Seawall B, drip tray(s) should be provided to chemicals.
4. Near Substation, watering should be provided to concrete breaking works. |
1. At Seawall B, tarpaulin sheets had been deployed between the loading barge and edge of seawall to avoid rubbish entering the sea. Floating refuse had been removed from sea.
2. Near Substation and Seawall A (Caisson 73), housekeeping had been enhanced.
3. At Seawall B, chemicals had been removed and stored in designated area.
4. Near Substation, watering had been provided to concrete breaking works |
10.1 Works to be undertaken in the next reporting month are:
- Superstructure construction
· Seawall Portion:
- Construction of wave wall along the vertical seawall above +3mPD
10.2 Potential environmental impacts arising from the above construction activities are mainly associated with construction noise, waste management and ecology. 10.3 The key environmental mitigation measures for the Project in the coming reporting period expected to be associated with the construction activities include:· Reduction of noise from equipment and machinery on-site;
· Sorting, recycling, storage and disposal of general refuse and construction waste;
· Management of chemicals and avoidance of oil spillage on-site, especially under heavy rains and adverse weather;
· Dust control of exposed soil surface and stockpile of dusty material at reclaimed area;
· Dust suppression measures for exposed earth surface and stockpile of dusty material; and
· Site runoff control measure during construction works.
10.4 The tentative schedule of regular construction noise and ecology monitoring in the next reporting period is presented in Appendix M. The regular construction noise and ecology monitoring will be conducted at the same monitoring locations in the next reporting period.
11. Conclusion and Recommendations
11.1 This 88th monthly Environmental Monitoring and Audit (EM&A) Report presents the EM&A works undertaken during the period from 1 October to 31 October 2025, in accordance with the Updated EM&A Manual and the requirement under EP-429/2012/A and FEP-01/429/2012/A. 11.2 Construction noise, construction waste, coral and WBSE monitoring were carried out in the reporting period. No project-related exceedance of the Action and Limit Level was recorded from 1 October to 31 October 2025. 11.3 Weekly environmental site inspections were conducted during the reporting period. Environmental deficiencies were observed during site inspection and were rectified. 11.4 According to the environmental site inspections performed in the reporting month, the Contractor was reminded to pay attention on proper storage of chemicals, proper dust suppression measure to concrete breaking works, regular maintenance to surface runoff prevent measure, proper storage of general wastes for maintaining housekeeping and timely disposal of general wastes form site. 11.5 No environmental complaint was received in the reporting period. 11.6 No notification of summon or prosecution was received since commencement of the Contract. 11.7 The ET will keep track of the construction works to confirm compliance of environmental requirements and the proper implementation of all necessary mitigation measures.