A1.
The Project, Integrated Waste Management
Facility (IWMF), is a Designated Project under the Environmental Impact
Assessment Ordinance (Cap. 499) (EIAO) and is currently governed by a Further
Environmental Permit (FEP No. FEP-01/429/2012/A) for the construction and
operation of the Project.
A2.
In accordance with the Updated Environmental
Monitoring and Audit (EM&A) Manual for the Project, EM&A works for
marine water quality, noise, waste management and ecology should be carried out
by Environmental Team (ET), Acuity Sustainability Consulting Limited (ASCL), during
the construction phase of the Project.
A3.
This is the 3rd Quarterly EM&A Report, prepared by ASCL, for the Project
summarizing and concluding the
monitoring results and audit findings of the EM&A programme at and around
Shek Kwu Chau (SKC) during the reporting period from 1 January 2019 to 31 March 2019.
A4.
The EM&A works for construction noise, water
quality, construction waste, coral, marine mammal and White-Bellied Sea Eagle
(WBSE) were conducted during the reporting period in accordance with the
Updated EM&A Manual.
A5.
Weekly site inspections of the construction
works were carried out by ET to
audit the mitigation measures implementation status. Monthly joint site
inspections were carried out by ET and IEC.
1.
Basic Project Information
1.1.
The Reporting Scope
1.1.1
This is the 3rd Quarterly EM&A
Report for the Project which summarizes the key findings of the EM&A
programme during the reporting period from 1 January 2019 to 31 March 2019.
1.2.
Project Organization
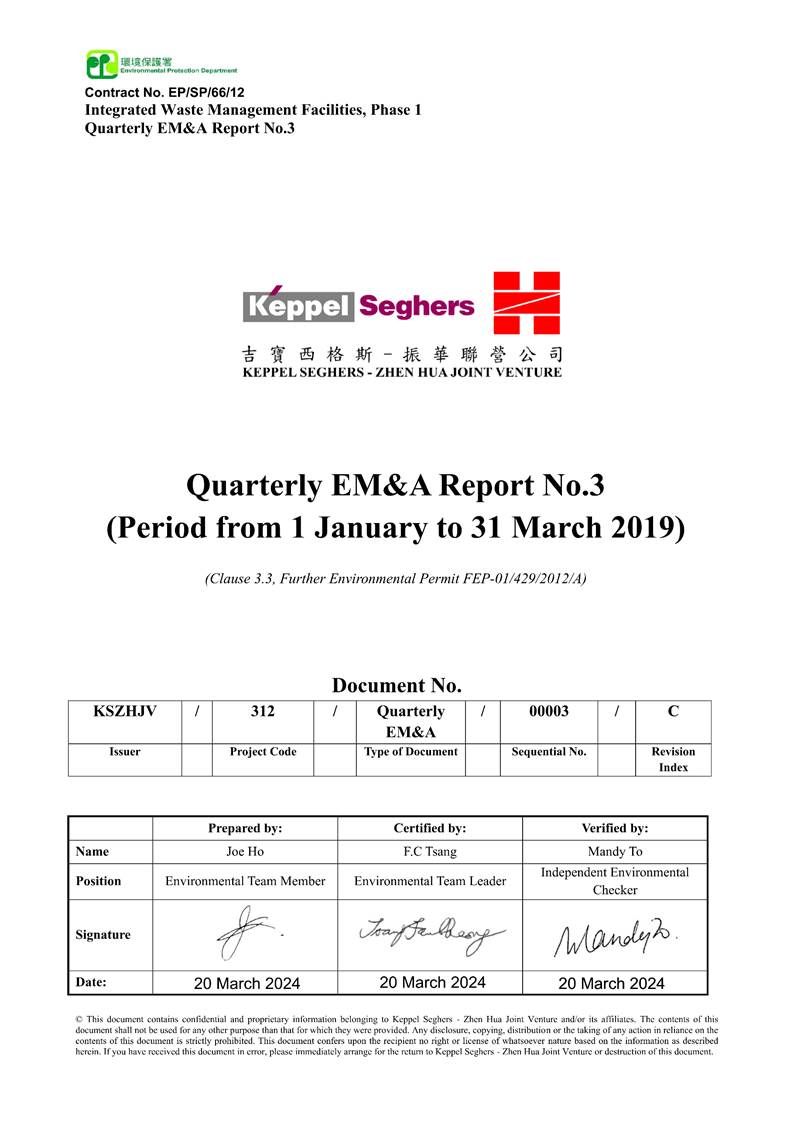
1.1.2
The Project Organization structure for
Construction Phase is presented
in Figure 1.1.
|
|
Figure 1.1 Project
Organization Chart
|
1.1.3
Contact details of the key personnel are presented
in Table 1.1 below:
Table 1.1 Contact Details of Key Personnel
|
Party
|
Position
|
Name
|
Telephone no.
|
|
Environmental
Protection Department
|
Project
Proponent
|
Cheng Tak-Kuen
|
2594-6111
|
|
Keppel Seghers
¡V Zhen Hua Joint Venture
|
Project
Manager
|
Kenny Yu
|
2192-0606
|
|
Acuity
Sustainability Consulting Limited
|
Environmental
Team Leader
|
Robin Ho
|
2698-6833
|
|
ERM-Hong Kong,
Limited
|
Independent
Environmental Checker
|
Mandy To
|
2271-3000
|
1.3.
Summary of Construction Works
1.1.4
Details of the major construction activities
undertaken in this reporting period are shown in Table 1.2 below. The construction programme is presented in Appendix A.
Table 1.2 Summary of the Construction Activities Undertaken during the Reporting Period
|
Location of works
|
Construction activities undertaken
|
Remarks on progress
|
|
Seawall and
breakwater locations
|
¡P
Marine site
investigation works
|
¡P
Completed
|
|
Location of
DCM Site Trial
|
¡P
Coring of DCM
samples
|
¡P
Completed
|
|
Seawall
locations
|
¡P
Collecting of
Marine Sediment Samples
|
¡P
Completed
|
|
Location of
DCM Static Loading Test
|
¡P
DCM installation
|
¡P
Completed
|
|
Seawall and
berth area
|
¡P
Laying of
Geotextile and Sand Blanket
|
¡P
73 out of 95
geotextiles were laid
¡P
Completed for sand
blanket laying
|
|
Seawall and
berth area
|
¡P
DCM installation
¡P
Dredging operation
|
¡P
On-going
|
1.1.5
The status for all environmental aspects is
presented in Table 1.3.
Table 1.3 Summary of Status
for Key Environmental Aspects under the Updated EM&A Manual
1.1.6
Other than the EM&A works by ET, environmental
briefings, trainings and
regular environmental management meetings were conducted, in order to enhance
environmental awareness and closely monitor the environmental performance of
the contractors.
1.1.7
The EM&A programme has been implemented in
accordance with the recommendations presented in the approved EIA Report and
the Updated EM&A Manual. A summary of updated implementation status of the
environmental mitigation measures for the construction phase of the Project
during the reporting period is provided in Appendix B.
2.
Marine Water Quality Monitoring
2
2.1
Water
Quality Parameters
2.1.1
Measurement of Dissolved Oxygen (DO), Turbidity,
Suspended Solids (SS), Salinity and pH have been undertaken at the eleven
monitoring stations during general water quality monitoring. Besides the above
parameters, monitoring of Total Alkalinity, Current Velocity and Current
Direction have been undertaken at all fourteen monitoring stations (including
S1, S2 and S3) during regular DCM monitoring.
2.1.2
Current velocity and direction, DO, temperature,
salinity, turbidity and pH were measured in-situ and the SS, Total Alkalinity
were assayed in a HOKLAS laboratory.
2.1.3
In associate with the water quality parameters,
other relevant data were also measured, such as monitoring location/position,
time, water depth, sampling depth, tidal stages, weather conditions and any
special phenomena or work underway nearby were also recorded.
2.1.4
The initial intensive DCM monitoring programme
has been conducted daily from 11 February to 24 February 2019 and conducted
every two days from 25 February to 10 March 2019. The actual duration of the
initial DCM monitoring might extend beyond four weeks should there be any
exceedances in specific-DCM parameters (Temperature & Alkalinity) of water
quality action and limit levels.
2.1.5
Table 2.1
summarizes the monitoring parameters, frequency and duration of the impact water
quality monitoring.
Table 2.1 Water Quality Monitoring Parameters, Frequency
and Duration
|
Parameter,
unit
|
Frequency
|
No.
of Depths
|
|
¡P
Water Depth(m)
¡P
Temperature(oC)
¡P
Salinity(ppt)
¡P
pH (pH unit)
¡P
Dissolved Oxygen (DO)(mg/L and % of saturation)
¡P
Turbidity(NTU)
¡P
Suspended Solids (SS), mg/L
¡P
Total alkalinity
¡P
Current velocity
¡P
Direction
|
General
water quality monitoring and Regular DCM monitoring:
3
days per week, at mid-flood and mid-ebb tides
*Intensive
DCM monitoring:
Daily
in first 2 weeks, at mid-flood and mid-ebb tides. if no exceedance is
recorded within the first two weeks, then the monitoring frequency can be
reduced to every two days.
|
3
water depths: 1m below sea surface, mid-depth and 1m above sea bed.
If
the water depth is less than 3m, mid-depth sampling only.
If
water depth is less than 6m, mid-depth may be omitted.
|
Note:
*Exccedances referred to total alkalinity and temperature only. These should be
confirmed by ET and verified by IEC as project-related.
2.2
Water
Quality Monitoring Locations
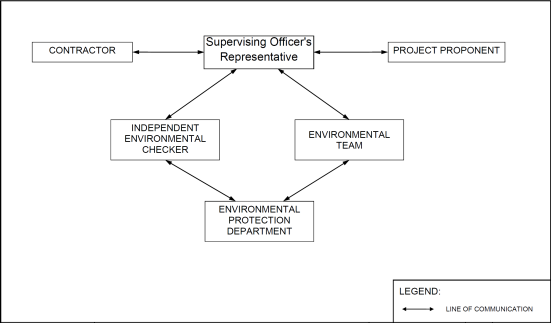
2.2.1
Impact water quality monitoring was conducted at
eleven monitoring locations during general water quality monitoring and
fourteen water monitoring locations during regular DCM monitoring, as shown in Figure
2.1.
|
Figure 2.1 Water monitoring locations at Artificial Island near SKC
|
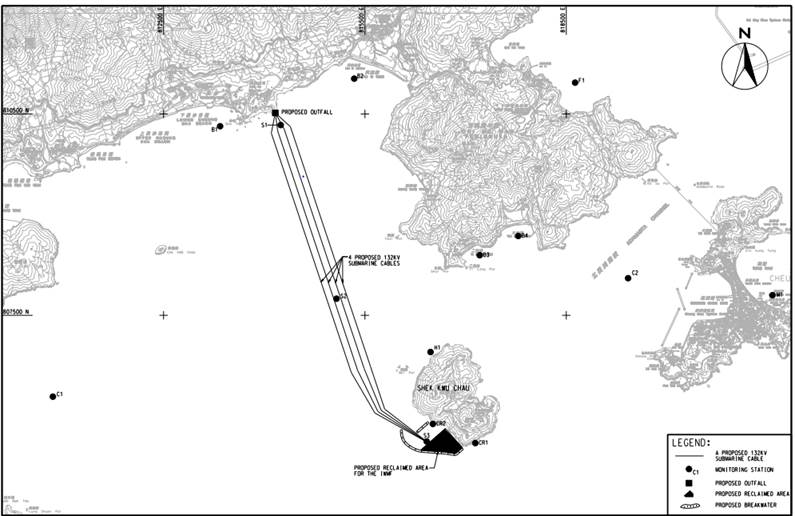
2.2.2
For initial intensive DCM monitoring, mobile
impact monitoring stations shall be located within fixed distances from the DCM
group works area to obtain water quality information in the immediate upstream
and downstream area. A total of 12 nos. monitoring stations will be deployed
with the following arrangement and illustrated in Figure 2.2.
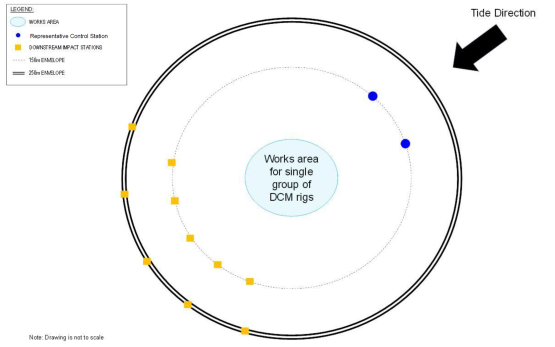
Figure 2.2 Water monitoring locations during intensive DCM monitoring
2.3
Action
and Limit Levels
2.3.1
Based on the baseline monitoring data and the
derivation criteria specified in the Updated EM&A Manual and Detailed Plan on Deep Cement Mixing, the Action/Limit
Levels are presented in Table 2.2.
Table 2.2 Derived Action and Limit Levels for Water Quality Monitoring (Dry
Season)
|
Parameters
|
Action
|
Limit
|
|
Construction Phase
Impact Monitoring
|
|
DO in mg/L
|
≤ 7.13
|
≤ 4
|
|
SS in mg/L
|
≥ 8 or 120% of control
station¡¦s SS at the same tide of the same day of measurement, whichever is
higher
|
≥ 10 or 130% of
control station's SS at the same tide of the same day of measurement,
whichever is higher
|
|
Turbidity in NTU
|
≥ 5.6 or 120% of
control station¡¦s turbidity at the same tide of the same day of measurement,
whichever is higher
|
≥ 12.81 or 130% of
control station's turbidity at the same tide of the same day of measurement,
whichever is higher
|
|
Temperature in¢XC
|
1.8¢XC above the
temperature recorded at representative control station at the same tide of
the same day
|
2¢XC above the
temperature recorded at representative control station at the same tide of
the same day
|
|
Total Alkalinity in mg/L
|
≥116 or 120% of
control station¡¦s Total Alkalinity at the same tide of the same day of
measurement, whichever is higher
|
≥ 118 or 130% of
control station¡¦s Total Alkalinity at the same tide of the same day of
measurement, whichever is higher
|
Notes:
i.
"Depth-averaged"
is calculated by taking the arithmetic means of reading of all three depths.
ii.
For
DO, non-compliance of the water quality limits occurs when monitoring result is
lower than the limits.
iii.
For
turbidity, SS and Salinity, non-compliance of the water quality limits occurs
when monitoring result is higher than the limits.
2.3.2
The Action and Limit (AL) levels for
DCM-specific and other water quality parameters during initial intensive DCM
monitoring with referring to Detailed Plan on Deep Cement Mixing, as shown in Table
2.3 and 2.4 below respectively.
Table 2.3 Action and Limit Levels for
DCM-specific Water Quality Parameters (Intensive DCM Monitoring)
|
Parameters
|
Action
|
Limit
|
|
Construction Phase
Impact Monitoring
|
|
Temperature
in¢XC
|
1.8¢XC
above the temperature recorded at representative control station at the same
tide of the same day
|
2¢XC
above the temperature recorded at representative control station at the same
tide of the same day
|
|
Total Alkalinity in
mg/L
|
95 percentile of baseline
data or 120% of representative control station at the same tide of the same
day, whichever is higher
|
99 percentile of
baseline data or 130% of representative control station at the same tide of
the same day, whichever is higher
|
Notes:
i.
"Depth-averaged"
is calculated by taking the arithmetic means of reading of all three depths.
ii.
For
Temperature and Total Alkalinity, non-compliance of the water quality limits
occurs when monitoring result is higher than the limits.
Table 2.4 Action and Limit Levels for Other
Water Quality Parameters (Intensive DCM Monitoring)
|
Parameters
|
Action
|
Limit
|
|
Construction Phase
Impact Monitoring
|
|
DO in mg/L (Surface
and middle)
|
80% of representative
control station at the same tide of the same day or 4mg/L, whichever is
lower.
|
70% of representative
control station at the same tide of the same day or 4mg/L, whichever is
lower.
|
|
DO in mg/L (Bottom)
|
80% of representative
control station at the same tide of the same day or 2mg/L, whichever is
lower.
|
70% of representative
control station at the same tide of the same day or 2mg/L, whichever is
lower.
|
|
SS in mg/L
|
120% of representative
control station at the same tide of the same day.
|
130% of representative
control station at the same tide of the same day.
|
|
Turbidity in NTU
|
Notes:
i.
"Depth-averaged"
is calculated by taking the arithmetic means of reading of all three depths.
ii.
For
DO, non-compliance of the water quality limits occurs when monitoring result is
lower than the limits.
iii.
For
SS and Turbidity, non-compliance of the water quality limits occurs when
monitoring result is higher than the limits.
2.4
Monitoring
Results and
Observations
2.4.1
DCM injection works and sand blanket laying
works were conducted during the reporting period, thus both general water
quality monitoring at the eleven monitoring stations and general DCM monitoring including monitoring
stations S1, S2 and S3 were conducted. Monitoring results of 7 key parameters:
Salinity, DO, turbidity, SS, pH, temperature and total alkalinity in each month
of this reporting period, are summarized in Table 2.5, and results
trending are presented graphically in Appendix C.
2.4.2
During the reporting period, initial intensive
DCM water quality monitoring was conducted between 25 February to 10 March 2019
at all twelve monitoring stations consisting of UC1, UC2 and I1 to I10. Monitoring results of 7 key
parameters: Salinity, DO, turbidity, SS, pH, temperature and total alkalinity
for initial intensive DCM monitoring in this reporting month, are summarized in
Table 2.6, and details results are presented in Appendix C.
Table 2.5 Summary of Regular DCM Impact Water Quality Monitoring Results
|
Locations
|
Parameters
|
|
Salinity
(ppt)
|
Dissolved
Oxygen (mg/L)
|
pH
|
Turbidity
(NTU)
|
Suspended
Solids (mg/L)
|
Temp.
(oC)
|
Total
Alkalinity (mg/L)
|
|
Surface
& Middle
|
Bottom
|
|
Jan
|
Feb
|
Mar
|
Jan
|
Feb
|
Mar
|
Jan
|
Feb
|
Mar
|
Jan
|
Feb
|
Mar
|
Jan
|
Feb
|
Mar
|
Jan
|
Feb
|
Mar
|
Jan
|
Feb
|
Mar
|
Jan
|
Feb
|
Mar
|
|
B1
|
Avg.
|
30.19
|
30.70
|
30.60
|
9.16
|
10.48
|
10.56
|
9.15
|
10.52
|
10.54
|
8.15
|
8.43
|
8.93
|
4.3
|
3.4
|
2.5
|
6.69
|
4.28
|
5.23
|
20.1
|
21.2
|
20.8
|
112.9
|
111.8
|
110.3
|
|
Min.
|
29.04
|
29.36
|
27.45
|
8.23
|
8.70
|
7.91
|
8.29
|
8.56
|
7.67
|
8.00
|
8.01
|
8.28
|
2.1
|
1.2
|
1.2
|
2.00
|
2.00
|
2.00
|
17.6
|
19.8
|
17.2
|
111.0
|
110.0
|
90.0
|
|
Max.
|
31.57
|
32.94
|
33.60
|
10.32
|
13.43
|
13.04
|
10.30
|
14.06
|
13.01
|
8.48
|
9.17
|
9.51
|
8.3
|
4.8
|
4.5
|
11.00
|
10.00
|
12.00
|
22.8
|
22.8
|
23.9
|
115.0
|
113.0
|
113.0
|
|
B2
|
Avg.
|
30.23
|
30.71
|
30.61
|
9.31
|
10.59
|
10.40
|
9.30
|
10.61
|
10.40
|
8.15
|
8.40
|
8.89
|
4.3
|
3.4
|
2.3
|
6.53
|
3.88
|
5.28
|
20.1
|
21.2
|
20.8
|
113.0
|
111.8
|
110.7
|
|
Min.
|
29.05
|
29.11
|
27.52
|
8.48
|
8.57
|
7.54
|
8.40
|
8.59
|
7.65
|
8.00
|
8.01
|
8.24
|
1.6
|
1.2
|
0.6
|
3.00
|
2.00
|
2.00
|
17.6
|
19.8
|
17.3
|
111.0
|
110.0
|
91.0
|
|
Max.
|
31.80
|
33.77
|
33.28
|
10.69
|
14.01
|
12.77
|
10.62
|
13.77
|
12.85
|
8.50
|
9.14
|
9.51
|
8.0
|
4.9
|
4.8
|
13.00
|
9.00
|
10.00
|
22.8
|
22.8
|
23.9
|
115.0
|
113.0
|
113.0
|
|
B3
|
Avg.
|
30.20
|
30.85
|
30.76
|
9.23
|
10.65
|
10.24
|
9.23
|
10.62
|
10.27
|
8.14
|
8.43
|
8.94
|
4.3
|
3.4
|
2.3
|
7.07
|
4.21
|
5.41
|
20.1
|
21.1
|
20.7
|
113.0
|
111.8
|
110.8
|
|
Min.
|
29.01
|
29.37
|
27.49
|
8.36
|
8.67
|
7.87
|
8.21
|
8.54
|
7.77
|
8.00
|
8.00
|
8.19
|
2.0
|
1.1
|
0.7
|
3.00
|
2.00
|
2.00
|
17.6
|
19.8
|
17.5
|
111.0
|
110.0
|
104.0
|
|
Max.
|
31.77
|
33.61
|
33.37
|
10.51
|
13.87
|
12.32
|
10.45
|
13.75
|
12.35
|
8.50
|
9.15
|
9.46
|
8.0
|
5.0
|
4.9
|
17.00
|
8.00
|
12.00
|
22.8
|
22.8
|
23.9
|
115.0
|
113.0
|
113.0
|
|
B4
|
Avg.
|
30.19
|
30.62
|
30.55
|
9.18
|
10.48
|
10.57
|
9.15
|
10.44
|
10.52
|
8.15
|
8.43
|
8.91
|
4.3
|
3.4
|
2.5
|
7.29
|
4.52
|
5.17
|
20.1
|
21.2
|
20.7
|
113.1
|
111.9
|
111.0
|
|
Min.
|
29.20
|
29.11
|
27.31
|
8.28
|
8.69
|
7.77
|
8.34
|
8.70
|
7.84
|
8.00
|
8.00
|
8.31
|
1.6
|
1.0
|
0.7
|
2.00
|
2.00
|
2.00
|
17.6
|
19.8
|
17.2
|
111.0
|
110.0
|
107.0
|
|
Max.
|
31.76
|
33.28
|
33.40
|
10.47
|
13.46
|
12.99
|
10.30
|
13.99
|
12.89
|
8.49
|
9.16
|
9.50
|
8.2
|
4.6
|
4.8
|
17.00
|
9.00
|
12.00
|
22.8
|
22.8
|
23.9
|
115.0
|
114.0
|
114.0
|
|
C1
|
Avg.
|
30.16
|
30.73
|
30.53
|
9.19
|
10.71
|
10.33
|
9.19
|
10.76
|
10.36
|
8.17
|
8.45
|
8.91
|
4.3
|
3.3
|
2.4
|
7.28
|
4.12
|
5.50
|
20.1
|
21.2
|
20.8
|
113.1
|
111.6
|
110.9
|
|
Min.
|
29.13
|
29.12
|
27.47
|
7.99
|
8.57
|
7.55
|
8.03
|
8.58
|
7.63
|
8.00
|
8.00
|
8.13
|
2.1
|
1.3
|
1.0
|
3.00
|
2.00
|
2.00
|
17.6
|
19.8
|
17.3
|
111.0
|
110.0
|
106.0
|
|
Max.
|
31.76
|
33.85
|
33.35
|
10.63
|
13.88
|
12.90
|
10.60
|
13.79
|
12.50
|
8.50
|
9.17
|
9.56
|
8.2
|
4.8
|
4.9
|
15.00
|
12.00
|
11.00
|
22.8
|
22.8
|
23.9
|
116.0
|
113.0
|
114.0
|
|
C2
|
Avg.
|
30.15
|
30.62
|
30.56
|
9.24
|
10.53
|
10.35
|
9.24
|
10.54
|
10.35
|
8.13
|
8.43
|
8.92
|
4.3
|
3.3
|
2.5
|
7.88
|
4.44
|
5.55
|
20.1
|
21.2
|
20.7
|
113.1
|
111.8
|
110.9
|
|
Min.
|
29.12
|
29.18
|
27.59
|
7.80
|
8.57
|
7.65
|
7.98
|
8.76
|
7.63
|
8.00
|
8.01
|
8.16
|
1.8
|
1.3
|
1.1
|
3.00
|
2.00
|
2.00
|
17.6
|
19.8
|
17.3
|
111.0
|
110.0
|
106.0
|
|
Max.
|
31.79
|
33.87
|
33.14
|
10.45
|
13.91
|
13.03
|
10.43
|
14.01
|
13.06
|
8.50
|
9.17
|
9.43
|
8.5
|
5.1
|
4.7
|
17.00
|
9.00
|
11.00
|
22.8
|
22.8
|
23.9
|
115.0
|
113.0
|
114.0
|
|
CR1
|
Avg.
|
30.20
|
30.71
|
30.58
|
9.29
|
10.63
|
10.50
|
9.29
|
10.61
|
10.44
|
8.15
|
8.43
|
8.93
|
4.3
|
3.3
|
2.3
|
7.04
|
4.08
|
5.64
|
20.1
|
21.2
|
20.7
|
113.0
|
112.0
|
110.9
|
|
Min.
|
29.19
|
29.06
|
27.73
|
8.58
|
8.56
|
7.58
|
8.57
|
8.55
|
7.74
|
8.00
|
8.00
|
8.14
|
1.5
|
1.2
|
0.4
|
2.00
|
2.00
|
2.00
|
17.6
|
19.8
|
17.3
|
111.0
|
111.0
|
106.0
|
|
Max.
|
31.57
|
33.24
|
33.07
|
10.48
|
13.94
|
13.04
|
10.57
|
13.98
|
13.04
|
8.50
|
9.17
|
9.52
|
7.9
|
4.9
|
4.8
|
11.00
|
8.00
|
12.00
|
22.8
|
22.8
|
23.9
|
115.0
|
113.0
|
114.0
|
|
CR2
|
Avg.
|
30.15
|
30.61
|
30.50
|
9.22
|
10.31
|
10.15
|
9.24
|
10.40
|
10.15
|
8.15
|
8.44
|
8.91
|
4.3
|
3.3
|
2.5
|
6.52
|
4.48
|
5.92
|
20.1
|
21.1
|
20.7
|
113.0
|
111.9
|
110.8
|
|
Min.
|
29.17
|
29.09
|
27.54
|
8.26
|
8.70
|
7.65
|
8.28
|
8.75
|
7.71
|
8.00
|
8.00
|
8.14
|
1.9
|
1.2
|
0.6
|
2.00
|
2.00
|
2.00
|
17.6
|
19.8
|
17.2
|
111.0
|
111.0
|
106.0
|
|
Max.
|
31.77
|
33.86
|
33.42
|
10.34
|
13.71
|
12.33
|
10.34
|
13.44
|
12.30
|
8.49
|
9.17
|
9.51
|
7.9
|
4.8
|
4.9
|
13.00
|
12.00
|
11.00
|
22.8
|
22.8
|
23.9
|
116.0
|
113.0
|
114.0
|
|
F1
|
Avg.
|
30.23
|
30.82
|
30.67
|
9.19
|
10.40
|
10.43
|
9.19
|
10.40
|
10.45
|
8.13
|
8.42
|
8.93
|
4.4
|
3.3
|
2.3
|
7.83
|
4.27
|
5.88
|
20.1
|
21.2
|
20.7
|
112.9
|
111.9
|
111.0
|
|
Min.
|
29.05
|
29.45
|
27.63
|
8.16
|
8.59
|
7.64
|
8.33
|
8.56
|
7.61
|
8.00
|
8.00
|
8.18
|
1.6
|
1.0
|
0.7
|
3.00
|
2.00
|
2.00
|
17.6
|
19.8
|
17.4
|
111.0
|
111.0
|
107.0
|
|
Max.
|
31.75
|
33.59
|
33.34
|
10.38
|
13.61
|
13.00
|
10.41
|
13.48
|
13.05
|
8.50
|
9.15
|
9.57
|
8.1
|
4.9
|
5.0
|
20.00
|
9.00
|
12.00
|
22.8
|
22.8
|
23.9
|
115.0
|
113.0
|
114.0
|
|
H1
|
Avg.
|
30.19
|
30.79
|
30.57
|
9.22
|
10.61
|
10.23
|
9.23
|
10.58
|
10.23
|
8.13
|
8.42
|
8.92
|
4.3
|
3.3
|
2.3
|
7.84
|
4.40
|
5.48
|
20.1
|
21.2
|
20.7
|
113.1
|
111.8
|
110.9
|
|
Min.
|
29.06
|
29.42
|
27.40
|
7.76
|
8.57
|
7.62
|
7.97
|
8.59
|
7.67
|
8.00
|
8.00
|
8.26
|
2.0
|
1.2
|
1.1
|
4.00
|
2.00
|
2.00
|
17.6
|
19.8
|
17.2
|
111.0
|
110.0
|
106.0
|
|
Max.
|
31.77
|
33.84
|
33.43
|
10.40
|
14.07
|
13.01
|
10.28
|
13.61
|
12.80
|
8.50
|
9.17
|
9.50
|
8.2
|
4.8
|
4.9
|
16.00
|
10.00
|
12.00
|
22.8
|
22.8
|
23.9
|
115.0
|
114.0
|
114.0
|
|
M1
|
Avg.
|
30.18
|
30.71
|
30.38
|
9.22
|
10.61
|
10.45
|
9.23
|
10.61
|
10.42
|
8.14
|
8.42
|
8.91
|
4.3
|
3.3
|
2.2
|
8.26
|
4.66
|
6.32
|
20.1
|
21.2
|
20.7
|
113.0
|
111.9
|
110.5
|
|
Min.
|
29.04
|
29.42
|
27.44
|
8.08
|
8.55
|
7.60
|
8.08
|
8.60
|
7.90
|
8.00
|
8.00
|
8.13
|
2.0
|
1.0
|
1.0
|
3.00
|
2.00
|
2.00
|
17.6
|
19.8
|
17.2
|
110.0
|
110.0
|
82.0
|
|
Max.
|
31.79
|
33.71
|
32.72
|
10.34
|
13.82
|
13.25
|
10.32
|
13.29
|
12.99
|
8.50
|
9.13
|
9.53
|
7.9
|
5.1
|
4.9
|
19.00
|
15.00
|
11.00
|
22.8
|
22.8
|
23.9
|
115.0
|
113.0
|
114.0
|
|
S1
|
Avg.
|
30.11
|
30.56
|
30.56
|
9.16
|
10.97
|
10.97
|
9.17
|
10.94
|
10.94
|
8.15
|
8.23
|
8.23
|
4.3
|
3.1
|
3.1
|
6.85
|
4.63
|
4.63
|
20.1
|
21.6
|
21.6
|
113.0
|
111.9
|
111.9
|
|
Min.
|
29.18
|
29.71
|
29.71
|
7.90
|
10.06
|
10.06
|
7.87
|
10.22
|
10.22
|
8.00
|
8.01
|
8.01
|
1.7
|
1.1
|
1.1
|
2.00
|
2.00
|
2.00
|
17.6
|
20.6
|
20.6
|
110.0
|
111.0
|
111.0
|
|
Max.
|
31.69
|
31.79
|
31.79
|
10.24
|
11.96
|
11.96
|
10.31
|
11.65
|
11.65
|
8.48
|
8.46
|
8.46
|
8.5
|
4.0
|
4.0
|
14.00
|
10.00
|
10.00
|
22.8
|
22.7
|
22.7
|
116.0
|
113.0
|
113.0
|
|
S2
|
Avg.
|
30.20
|
30.66
|
30.51
|
9.27
|
10.85
|
11.38
|
9.28
|
10.92
|
11.35
|
8.14
|
8.27
|
8.87
|
4.3
|
3.1
|
2.5
|
7.02
|
5.31
|
5.72
|
20.1
|
21.6
|
21.2
|
113.0
|
111.9
|
110.9
|
|
Min.
|
29.06
|
29.73
|
27.57
|
7.99
|
9.88
|
9.80
|
8.09
|
10.20
|
9.64
|
8.00
|
8.03
|
8.34
|
2.1
|
1.2
|
1.4
|
2.00
|
3.00
|
3.00
|
17.6
|
20.6
|
17.2
|
111.0
|
111.0
|
106.0
|
|
Max.
|
31.80
|
31.79
|
33.23
|
10.49
|
11.66
|
13.13
|
10.60
|
11.75
|
13.05
|
8.47
|
8.49
|
9.55
|
8.2
|
4.0
|
3.5
|
16.00
|
9.00
|
11.00
|
22.8
|
22.7
|
23.9
|
116.0
|
114.0
|
114.0
|
|
S3
|
Avg.
|
30.14
|
30.69
|
30.61
|
9.24
|
11.05
|
11.40
|
9.24
|
11.01
|
11.40
|
8.15
|
8.24
|
8.87
|
4.3
|
3.3
|
2.3
|
7.65
|
5.43
|
6.20
|
20.1
|
21.6
|
21.2
|
112.9
|
111.8
|
111.0
|
|
Min.
|
29.02
|
29.82
|
27.32
|
8.15
|
9.99
|
9.39
|
8.24
|
10.01
|
9.71
|
8.00
|
8.02
|
8.34
|
1.7
|
1.2
|
0.4
|
2.00
|
2.00
|
3.00
|
17.6
|
20.6
|
17.2
|
110.0
|
110.0
|
105.0
|
|
Max.
|
31.78
|
31.70
|
33.36
|
10.67
|
12.14
|
13.25
|
10.63
|
12.17
|
13.18
|
8.50
|
8.50
|
9.42
|
8.5
|
3.9
|
3.8
|
18.00
|
9.00
|
11.00
|
22.8
|
22.7
|
23.9
|
115.0
|
113.0
|
114.0
|
Notes:
i.
"Avg",
¡§Min¡¨ and ¡§Max¡¨ is the average, minimum and maximum respectively of the data
from measurements conducted under mid-flood and mid-ebb tides at three water
depths, except that of DO where the data for ¡§Surface & Middle¡¨ and
¡§Bottom¡¨ are calculated separately.
ii.
Table 2.6 Summary of Intensive DCM Impact Water Quality Monitoring Results
|
Locations
|
Parameters
|
|
Salinity
(ppt)
|
Dissolved
Oxygen (mg/L)
|
pH
|
Turbidity
(NTU)
|
Suspended
Solids (mg/L)
|
Temp.
(oC)
|
Total
Alkalinity (mg/L) note ii
|
|
Surface
& Middle
|
Bottom
|
|
UC1
|
Avg.
|
30.68
|
10.11
|
10.08
|
8.60
|
3.4
|
4.51
|
20.7
|
112.6
|
|
Min.
|
29.08
|
7.56
|
7.70
|
8.01
|
1.3
|
2.00
|
17.1
|
109.0
|
|
Max.
|
32.98
|
13.24
|
12.96
|
9.38
|
4.9
|
10.00
|
25.2
|
116.0
|
|
UC2
|
Avg.
|
30.68
|
10.06
|
10.04
|
8.61
|
3.4
|
4.82
|
20.7
|
112.6
|
|
Min.
|
29.13
|
7.58
|
7.67
|
8.00
|
1.3
|
2.00
|
17.1
|
109.0
|
|
Max.
|
32.84
|
13.04
|
12.87
|
9.47
|
5.0
|
10.00
|
25.2
|
116.0
|
|
I1
|
Avg.
|
30.66
|
10.16
|
10.19
|
8.60
|
3.4
|
4.69
|
20.7
|
112.6
|
|
Min.
|
29.06
|
7.56
|
7.79
|
8.00
|
1.3
|
2.00
|
17.1
|
108.0
|
|
Max.
|
32.91
|
13.08
|
12.92
|
9.49
|
5.0
|
10.00
|
25.2
|
117.0
|
|
I2
|
Avg.
|
30.65
|
10.05
|
10.07
|
8.59
|
3.4
|
5.17
|
20.7
|
112.5
|
|
Min.
|
29.02
|
7.64
|
7.57
|
8.00
|
1.7
|
2.00
|
17.1
|
109.0
|
|
Max.
|
33.12
|
13.08
|
13.03
|
9.48
|
5.0
|
14.00
|
25.2
|
117.0
|
|
I3
|
Avg.
|
30.72
|
10.03
|
10.04
|
8.60
|
3.4
|
4.95
|
20.7
|
112.5
|
|
Min.
|
29.04
|
7.65
|
7.57
|
8.00
|
1.0
|
2.00
|
17.1
|
109.0
|
|
Max.
|
32.99
|
13.30
|
13.02
|
9.46
|
4.9
|
16.00
|
25.2
|
116.0
|
|
I4
|
Avg.
|
30.67
|
10.13
|
10.15
|
8.59
|
3.4
|
4.90
|
20.7
|
112.7
|
|
Min.
|
29.07
|
7.57
|
7.96
|
8.00
|
1.8
|
2.00
|
17.1
|
109.0
|
|
Max.
|
32.71
|
12.99
|
13.13
|
9.46
|
5.0
|
9.00
|
25.2
|
116.0
|
|
I5
|
Avg.
|
30.72
|
10.13
|
10.12
|
8.60
|
3.4
|
5.35
|
20.7
|
112.6
|
|
Min.
|
29.03
|
7.84
|
7.59
|
8.00
|
1.0
|
2.00
|
17.1
|
108.0
|
|
Max.
|
33.07
|
13.08
|
12.80
|
9.49
|
5.1
|
14.00
|
25.2
|
116.0
|
|
I6
|
Avg.
|
30.63
|
10.12
|
10.14
|
8.60
|
3.4
|
4.94
|
20.7
|
112.5
|
|
Min.
|
29.06
|
7.55
|
7.74
|
8.00
|
1.2
|
2.00
|
17.2
|
109.0
|
|
Max.
|
33.05
|
13.31
|
12.95
|
9.46
|
5.0
|
12.00
|
25.2
|
116.0
|
|
I7
|
Avg.
|
30.75
|
10.10
|
10.07
|
8.59
|
3.4
|
5.19
|
20.7
|
112.5
|
|
Min.
|
29.10
|
7.58
|
7.73
|
8.00
|
1.5
|
2.00
|
17.1
|
109.0
|
|
Max.
|
33.09
|
13.01
|
12.93
|
9.48
|
4.9
|
10.00
|
25.2
|
115.0
|
|
I8
|
Avg.
|
30.67
|
10.10
|
10.11
|
8.59
|
3.4
|
4.96
|
20.7
|
112.6
|
|
Min.
|
29.06
|
7.59
|
7.76
|
8.00
|
0.9
|
2.00
|
17.2
|
109.0
|
|
Max.
|
33.04
|
12.85
|
13.05
|
9.41
|
5.0
|
11.00
|
25.2
|
116.0
|
|
I9
|
Avg.
|
30.65
|
10.09
|
10.10
|
8.60
|
3.4
|
5.24
|
20.7
|
112.7
|
|
Min.
|
29.02
|
7.71
|
7.77
|
8.00
|
1.5
|
2.00
|
17.1
|
109.0
|
|
Max.
|
33.00
|
12.97
|
12.86
|
9.49
|
4.9
|
16.00
|
25.2
|
116.0
|
|
I10
|
Avg.
|
30.73
|
10.13
|
10.13
|
8.60
|
3.4
|
5.49
|
20.7
|
112.4
|
|
Min.
|
29.11
|
7.65
|
7.79
|
8.00
|
1.1
|
2.00
|
17.1
|
78.0
|
|
Max.
|
33.09
|
13.02
|
12.84
|
9.45
|
5.0
|
13.00
|
25.2
|
116.0
|
2.4.3
Most of the monitoring results for temperature,
turbidity and total alkalinity obtained in the reporting period complied with
their corresponding Action and Limit levels, while
numbers of result for DO and SS triggered their corresponding Action or Limit
Levels, and investigations were conducted accordingly.
For the salinity, pH, DO, turbidity, temperature, SS and total alkalinity,
their trends were fluctuated independent to the site activities and presented
in Appendix C.
2.4.4
No major pollution source and extreme weather
which might affect the results were observed during the impact monitoring.
2.4.5
During the regular DCM impact monitoring period
for January to March 2019, thirty-nine (39) and twenty-four (24) exceedances of
the Action and Limit for SS were recorded respectively. Investigations were conducted,
and results indicated the SS exceedances were not attributable to the Project
works. Details of the exceedance are presented in Section 8.
2.4.6
During the initial intensive DCM impact
monitoring period for 25 February to 10 March 2019, thirty (30) and ninety (90)
exceedances of the Action and Limit for SS were recorded respectively.
Investigations were conducted, and results indicated the SS exceedances were
not attributable to the Project works. Details of the exceedance are presented
in Section 8.
2.4.7
Implemented mitigation measures minimizing the adverse impacts on water are
listed in the implementation schedule given in Appendix B.
3.
Noise Monitoring
3
3.1
Noise
Monitoring Parameters
3.1.1
Impact noise monitoring was conducted weekly in
the reporting period between 0700-1900 on normal weekdays. Additional impact
noise monitoring was conducted weekly in the reporting period between 1900-0700
on all days as well as public holidays and Sundays.
3.1.2
Construction noise level measured in terms of
the A-weighted equivalent continuous sound pressure level (LAeq). Leq 30min was
used as the monitoring parameter for the time period between 0700 and 1900
hours on normal weekdays. Leq 5mins was used as the monitoring parameter for
the time period between 1900 and 0700 as well as public holidays and Sundays. Table
3.1 summarizes the monitoring parameters, frequency and duration of the
impact noise monitoring and additional impact noise monitoring.
Table 3.1 Noise Monitoring Parameters, Time, Frequency and Duration
|
Monitoring
Station
|
Time
|
Duration
|
Parameters
|
|
M1/
N_S1,
M2/
N_S2,
M3/
N_S3
|
Day
time:
0700-1900
hrs
(during
normal weekdays)
|
Once
per week
Leq
5min/Leq 30min (average
of 6 consecutive Leq 5min)
|
Leq,
L10 & L90
|
|
M1/
N_S1,
M2/
N_S2,
M3/
N_S3
|
Evening
time:
1900-2300
hrs (including normal weekdays, also public holidays and Sundays)
|
Once
per week
Leq
5min (3 sets of Leq 5min)
|
Leq,
L10 & L90
|
|
M1/
N_S1,
M2/
N_S2,
M3/
N_S3
|
Night
time:
2300-0700
hrs (including normal weekdays, also public holidays and Sundays)
|
Once
per week
Leq
5min (3 sets of Leq 5min)
|
Leq,
L10 & L90
|
3.2
Noise
Monitoring Locations
3.2.1
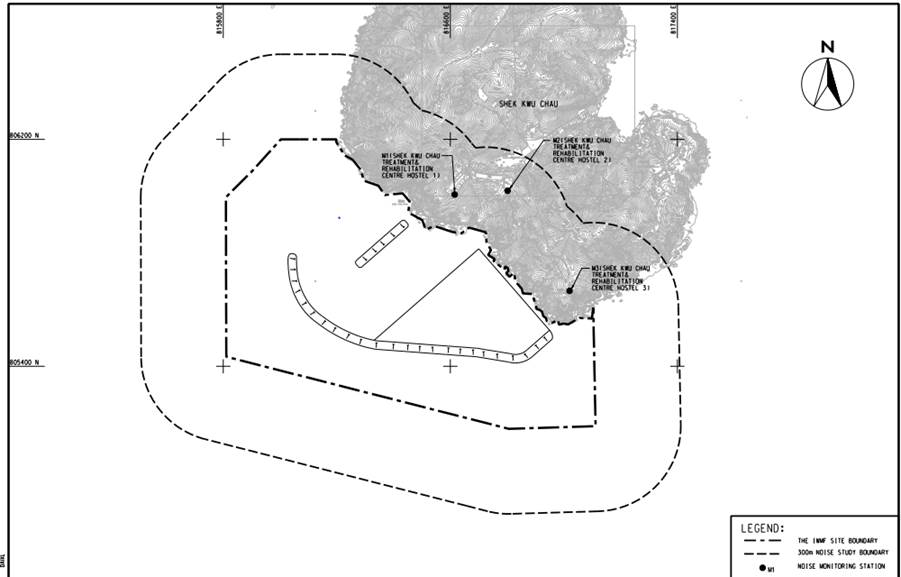
Three noise monitoring locations for impact
monitoring and additional impact monitoring at the nearby sensitive receivers
are shown in Figure 3.1
|
|
Figure 3.1 Noise
monitoring locations at SKC
|
3.2.2
M1, M2 and M3 are Shek Kwu Chau Treatment and
Rehabilitation Centre Hostel 1, 2 and 3 respectively of The Society for the Aid
and Rehabilitation of Drug Abusers (SARDA) located at southern part of Shek Kwu
Chau.
3.2.3
Measurement at M1, M2 and M3 were conducted at a
point 1m from the exterior of the sensitive receivers building façade and at a
position 1.2m above the ground. The noise
monitoring stations are summarized in Table 3.2 below.
Table 3.2 Noise Monitoring Location
|
Station
|
NSR
ID in EIA Report
|
Noise
Monitoring Location
|
Type
of sensitive receiver(s)
|
Measurement
Type
|
|
M1
|
N_S1
|
Shek
Kwu Chau Treatment & Rehabilitation Centre Hostel 1
|
Residential
|
Façade
|
|
M2
|
N_S2
|
Shek
Kwu Chau Treatment & Rehabilitation Centre Hostel 2
|
Residential
|
Façade
|
|
M3
|
N_S3
|
Shek
Kwu Chau Treatment & Rehabilitation Centre Hostel 3
|
Residential
|
Façade
|
3.3
Action
and Limit Levels
3.3.1
The Action/Limit Levels in line with the
criteria of Practice Note for Professional Persons (ProPECC PN 2/93) ¡§Noise
from Construction Activities ¡V Non-statutory Controls¡¨ and Technical Memorandum
on Environmental Impact Assessment Process issued by HKSAR Environmental
Protection Department [¡§EPD¡¨] under the Environmental Impact Assessment
Ordinance, Cap 499, S.16 is presented in Table 3.3.
Table 3.3 Action and Limit Levels for Noise per
Updated EM&A Manual
|
Time
Period
|
Action
|
Limit
(dB(A))
|
|
0700-1900
hrs on normal weekdays
|
When one
documented complaint is received
|
75 dB(A)
|
Notes: If works are to be carried out during
restricted hours, the conditions stipulated in the Construction Noise Permit
(CNP) issued by the Noise Control Authority have to be followed.
3.4
Monitoring
Results and Observations
3.4.1
Impact monitoring for noise impact was conducted
in the reporting period. The impact noise levels at Noise Monitoring Stations
at SKC (i.e. M1/ N_S1 to M3/ N_S3) are summarized in Table 3.5.
Additional impact monitoring during restricted hours was conducted in the
reporting period. The additional impact noise levels at Noise Monitoring
Stations at SKC (i.e. M1/ N_S1 to M3/ N_S3) are summarized in Table 3.6 and
Table 3.7 respectively. Trending of the noise monitoring
results is presented graphically in Appendix D.
3.4.2
Major construction activity, major noise source
and extreme weather which might affect the results were recorded during the
impact monitoring.
3.4.3
According to our field observations, the major
noise source identified at the designated noise monitoring station in the
reporting month are summarised in Table 3.4:
Table 3.4 Summary of Field Observation
|
Monitoring Station
|
Major Noise Source
|
|
M1
|
Nil
|
|
M2
|
Nil
|
|
M3
|
Air-conditioning
units nearby
|
3.4.4
No data from impact
monitoring during daytime has exceeded the stipulated limit level at 75 dB(A).
Table 3.5 Summary of Impact Noise Monitoring Results during Daytime
|
Location
|
Noise
in dB(A)
|
|
Range
of Leq 30min
|
Range
of L10 5min
|
Range
of L90 5min
|
|
Jan
|
Feb
|
Mar
|
Jan
|
Feb
|
Mar
|
Jan
|
Feb
|
Mar
|
|
M1
|
53.2
¡V 51.4
|
52.6
¡V 56.0
|
53.7
¡V 54.9
|
51.5
¡V 55.1
|
53.0
¡V 59.3
|
53.7
¡V 57.3
|
46.5
¡V 49.5
|
53.1
¡V 49.8
|
50.6
¡V 54.6
|
|
M2
|
55.0
¡V 55.9
|
54.6
¡V 58.2
|
55.1
¡V 56.5
|
56.2
¡V 62.6
|
55.0
¡V 63.3
|
55.4
¡V 58.9
|
50.9
¡V 55.7
|
50.5
¡V 55.9
|
51.2
¡V 55.6
|
|
M3
|
52.4
¡V 53.4
|
51.8
¡V 71.9
|
54.8
¡V 56.0
|
53.7
¡V 56.4
|
53.4
¡V 82.2
|
54.6
¡V 58.4
|
49.3
¡V 52.4
|
48.5
¡V 57.6
|
50.8
¡V 54.6
|
3.4.5
Applicable mitigation
measures for construction works are fully implemented as shown in Appendix B,
where double-glazed windows and air conditioning system were also installed and
confirmed operable for the NSRs (N_S1, N_S2 & N_S3).
3.4.6
During the noise monitoring
event, frontline staffs of ET have inquired the treatment centre users on any
noise disturbance from the construction activities at evening and night time,
where no complaint and adverse opinions was received.
3.4.7
Data from impact monitoring
during evening time and night time were compared with the NCO criteria. Where
site inspection and auditing on Contractor¡¦s record have shown that the
conditions stipulated in the Construction Noise Permit (CNP) issued by the Noise
Control Authority for construction works during restricted hours were followed.
No inappropriate practice were spotted during evening time and night time
construction works, thus the stipulated requirement on noise impact control
during night time and evening time was achieved.
Table 3.6 Summary of the Additional Impact
Noise Monitoring Results during Evening Time
|
Location
|
Noise
in dB(A)
|
|
Range
of Leq 5min
|
Range
of L10 5min
|
Range
of L90 5min
|
|
Jan
|
Feb
|
Mar
|
Jan
|
Feb
|
Mar
|
Jan
|
Feb
|
Mar
|
|
M1
|
NA
|
NA
|
55.0
¡V55.4
|
NA
|
NA
|
56.9
¡V57.3
|
NA
|
NA
|
53.6
¡V54.2
|
|
M2NOTE 1
|
NA
|
NA
|
NA
|
NA
|
NA
|
NA
|
NA
|
NA
|
NA
|
|
M3
|
NA
|
NA
|
53.0
¡V 54.7
|
NA
|
NA
|
54.8
¡V 56.6
|
NA
|
NA
|
52.3
¡V 53.3
|
Note1: An unexpected failure happened for the sound level
meter on monitoring station M2.
Table 3.7 Summary of Additional Impact
Noise Monitoring Results during Night Time
|
Location
|
Noise
in dB(A)
|
|
Range
of Leq 5min
|
Range
of L10 5min
|
Range
of L90 5min
|
|
Jan
|
Feb
|
Mar
|
Jan
|
Feb
|
Mar
|
Jan
|
Feb
|
Mar
|
|
M1
|
NA
|
NA
|
55.0
¡V 55.8
|
NA
|
NA
|
55.3
¡V 57.4
|
NA
|
NA
|
52.4
¡V 54.8
|
|
M2NOTE 1
|
NA
|
NA
|
NA
|
NA
|
NA
|
NA
|
NA
|
NA
|
NA
|
|
M3
|
NA
|
NA
|
53.3
¡V 53.9
|
NA
|
NA
|
55.3
¡V 55.6
|
NA
|
NA
|
52.4
¡V 53.1
|
Note1: An unexpected failure happened for the sound level
meter on monitoring station M2.
Table 4.1 Quantities of Waste Generated from the Project
|
Reporting Month
|
Actual
Quantities of Inert C&D Materials Generated Monthly
|
Actual
Quantities of C&D Wastes Generated Monthly
|
|
Total
Quantity Generated
|
Hard
Rock and Large Broken Concrete (see Note 1)
|
Reused
in the Contract
|
Reused
in other Projects
|
Disposed
as Public Fill
|
Imported
Fill
|
Metals
|
Paper
/ cardboard packaging
|
Plastics
(see Note 2)
|
Chemical
Waste
|
Others,
e.g. general refuse (see Note 3)
|
|
Sand
|
Public
Fill
|
Rock
|
|
(in
,000m3)
|
(in
,000m3)
|
(in
,000m3)
|
(in
,000m3)
|
(in
,000m3)
|
(in
,000m3)
|
(in
,000kg)
|
(in
,000kg)
|
(in
,000kg)
|
(in
,000kg)
|
(in
,000L)
|
(in
,000m3)
|
|
January
2019
|
0
|
0
|
0
|
0
|
0
|
82.6139
|
0
|
0
|
0
|
0
|
0
|
0
|
0
|
0.0065
|
|
February
2019
|
0
|
0
|
0
|
0
|
0
|
46.7821
|
0
|
0
|
0
|
0
|
0
|
0
|
0
|
0
|
|
March
2019
|
0
|
0
|
0
|
0
|
0
|
97.1
|
0
|
0.7552
|
0
|
0.256
|
0
|
0
|
0
|
0
|
Notes:
1.
Broken concrete for
recycling into aggregates.
2.
Plastic refer to
plastic bottles / containers, plastic sheets / foam from packaging materials.
3.
Use the conversion
factor: 1 full load of dumping truck being equivalent to 6.5m3 by
volume.
4.4
Although
there is not much waste generation in the reporting period from the Project,
the Contractor is reminded to sort and store any solid and liquid waste on-site
properly prior to disposal.
5.
Coral
5
5.1
Coral
Monitoring Parameters
5.1.1
Ten (10) tagged coral colonies at each site of
suggested control site and indirect impact site are being monitored weekly for
the first month and followed by monthly monitoring for three months. The
selected Control Site is located at Yuen Kong Chau of Soko Islands about 7 km
away from the project area. After the hitting of super typhoon Mangkhut in
mid-September 2018, the coral re-tagging activities at indirect impact site and
control site were conducted in November and December 2018 respectively. Tagged
coral colonies at the proposed recipient site are being monitored quarterly for
one year. The selected recipient site R3 is located the opposite side of the
Project area at about 2 km away.
5.1.2
Monitoring recorded the following parameters
(using the same methodology adopted during the pre-translocation survey); the
size, presence, health conditions (percentage of mortality/bleaching) and
percentage of sediment of each trans-located coral colony. The general environmental
conditions including weather, sea, and tidal conditions of survey sites were
monitored.
5.1.3
Health status of coral was assessed by the following criteria:
Hard coral: Percentage of surface
area exhibiting partial mortality and blanched/bleached area of each coral
colony and degree of sedimentation.
5.2
Coral
Monitoring Locations
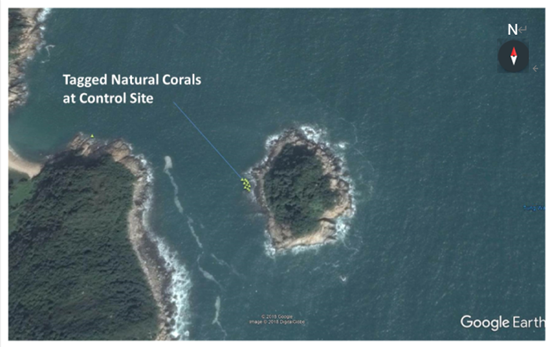
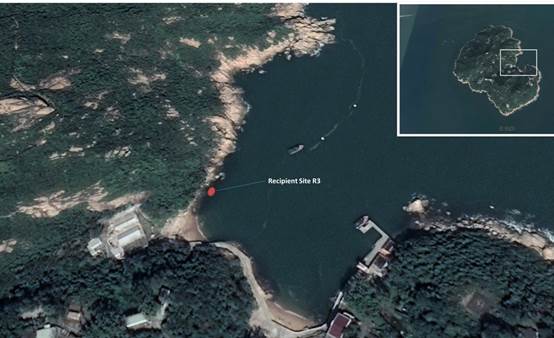
Location of
the ten tagged coral colonies at each of the proposed indirect impact site,
control site, the recipient site R3 and REA transect at proposed indirect
impact site are shown in Figure 5.1, Figure 5.2 and Figure 5.3
respectively:
|

|
|
Figure 5.1 Tagged Natural Corals at Indirect
Impact Site Near SKC for re-tagging after typhoon
Mangkhut
|
|
|
|
Figure 5.2 Tagged
Natural Corals at Control Site Near Yuen Kong Chau for re-tagging after
typhoon Mangkhut
|
|
|
|
Figure 5.3 Tagged Translocation Corals at
Recipient Site R3 near SKC
|
5.2.1
The GPS coordinates of the tagged coral colonies
and retagged coral colonies at both indirect impact site, control site and
recipient site R3 were shown in Table 5.1, Table 5.2 and Table
5.3 respectively.
Table 5.1 Tagged Natural Corals during Baseline and
Re-tagged Natural Corals after Typhoon Manghkut at
Control Site near Yuen Long Chau
|
Coral
# note i
|
GPS Coordinates
|
|
1
|
N22¢X09¡¦45.96¡¨
|
E113¢X54¡¦57.81¡¨
|
|
2R
|
N22¢X11¡¦29.12¡¨
|
E113¢X59¡¦09.01¡¨
|
|
3
|
N22¢X09¡¦45.81¡¨
|
E113¢X54¡¦57.78¡¨
|
|
4
|
N22¢X09¡¦45.70¡¨
|
E113¢X54¡¦57.95¡¨
|
|
5R
|
N22¢X11¡¦29.10¡¨
|
E113¢X59¡¦09.18¡¨
|
|
6
|
N22¢X09¡¦45.75¡¨
|
E113¢X54¡¦58.02¡¨
|
|
7R
|
N22¢X11¡¦29.17¡¨
|
E113¢X59¡¦08.86¡¨
|
|
7
|
N22¢X09¡¦45.65¡¨
|
E113¢X54¡¦57.94¡¨
|
|
8
|
N22¢X09¡¦45.53¡¨
|
E113¢X54¡¦57.90¡¨
|
|
9
|
N22¢X09¡¦46.23¡¨
|
E113¢X54¡¦54.70¡¨
|
|
10R
|
N22¢X11¡¦29.18¡¨
|
E113¢X59¡¦08.91¡¨
|
Notes:
i.
The
re-tagged corals were marked as ##R.
Table 5.2 Re-tagged Natural Corals after Typhoon
Manghkut at Indirect Impact Site near SKC
|
Coral
# note i
|
GPS Coordinates
|
|
11R
|
N22¢X11¡¦29.14¡¨
|
E113¢X59¡¦08.92¡¨
|
|
12R
|
N22¢X11¡¦29.12¡¨
|
E113¢X59¡¦09.01¡¨
|
|
13R
|
N22¢X11¡¦29.11¡¨
|
E113¢X59¡¦09.07¡¨
|
|
14R
|
N22¢X11¡¦29.13¡¨
|
E113¢X59¡¦09.12¡¨
|
|
15R
|
N22¢X11¡¦29.10¡¨
|
E113¢X59¡¦09.18¡¨
|
|
16R
|
N22¢X11¡¦29.07¡¨
|
E113¢X59¡¦09.23¡¨
|
|
17R
|
N22¢X11¡¦29.17¡¨
|
E113¢X59¡¦08.86¡¨
|
|
18R
|
N22¢X11¡¦29.14¡¨
|
E113¢X59¡¦08.94¡¨
|
|
19R
|
N22¢X11¡¦29.20¡¨
|
E113¢X59¡¦08.81¡¨
|
|
20R
|
N22¢X11¡¦29.18¡¨
|
E113¢X59¡¦08.91¡¨
|
Notes:
i.
The
re-tagged corals were marked as ##R.
Table 5.3 GPS Coordinates of Recipient Site
R3
|
Site
|
GPS Coordinates
|
|
R3
|
N22¢X11¡¦43.69¡¨
|
E113¢X28.99¡¨
|
5.3
Action
and Limit Levels
5.3.1
Monitoring result was reviewed and compared
against the below Action Level and Limit Level (AL/LL) as set with the below Table
5.4 and Table 5.5.
Table 5.4 Action and Limit
Levels for Construction Phase Coral Monitoring
|
Parameter
|
Action
Level
|
Limit
Level
|
|
Mortality
|
If during
Impact Monitoring a 15% increase in the percentage of partial mortality on
the corals occurs at more than 20% of the tagged indirect impact site coral
colonies that is not recorded on the tagged corals at the control site, then
the Action Level is exceeded.
|
If during
Impact Monitoring a 25% increase in the percentage of partial mortality on
the corals occurs at more than 20% of the tagged indirect impact site coral
colonies that is not recorded on the tagged corals at the control site, then
the Limit Level is exceeded.
|
Table 5.5 Action and Limit
Levels for Post-Translocation Coral Monitoring
|
Parameter
|
Action
Level
|
Limit
Level
|
|
Mortality
|
If during
Post-Translocation Monitoring a 15% increase in the percentage of partial
mortality on the corals occurs at more than 20% of the translocated coral
colonies that is not recorded on the original corals in the recipient site,
then the Action Level is exceeded.
|
If during
Post-Translocation Monitoring a 25% increase in the percentage of partial
mortality on the corals occurs at more than 20% of the translocated coral
colonies that is not recorded on the original corals in the recipient site,
then the Limit Level is exceeded.
|
5.4
Monitoring
Results and Observations
5.4.1
After the re-tagging activities were finished at
both Control site and Indirect Impact site (Figure 5.1 and 5.2
respectively), the additional monthly monitoring after coral re-tagging due to
the hitting of super typhoon Mangkhut in mid-September 2018 was conducted on 10
January 2019; and the weather condition was summarized in Table 5.6.
Table 5.6 Weather
Condition for the Additional Monthly Post Re-Tagging Monitoring at Control
Site and Indirect Impact Site
|
Date
|
Condition
|
Average Underwater
Visibility
|
|
10 January 2019
|
-
Northeast
force 4 to 5,
-
Sunny period
|
Less than 0.5m
|
5.4.2
Ten (10) hard coral colonies were monitored at
each site of Control and Indirect Impact sites as suggested in the Construction
Phase Monitoring Plan. The general health conditions (size, mortality,
bleaching and sediment) were recorded and summarized in Table 5.9 and Table
5.10. Photos of each tagged coral colonies were taken during the monitoring
activities and shown in Appendix F.
5.4.3
The 1st quarterly coral monitoring
during construction phase at both Indirect Impact Site and Control Site was
conducted on 28 March 2019 and the weather condition was summarized in Table
5.7.
Table 5.7 Weather Condition for the 1st
Quarterly Coral Monitoring during Construction Phase at both Indirect Impact
Site and Control Site
|
Date
|
Condition
|
Average Underwater
Visibility
|
|
28 March 2019
|
-
Northeast
force 3
-
Sunny period
|
Less than 0.5m
|
5.4.4
Ten (10) hard coral colonies were monitored at
each Control site and Indirect Impact Site as suggested in the Construction
Phase Monitoring Plan. The general health conditions (size, mortality,
bleaching and sediment) were recorded and summarized in Table 5.11 and Table
5.12. Photos of each coral colonies were taken during the monitoring
activities shown in Appendix F.
5.4.5
The 4th Post-Translocation Monitoring
was conducted on 28 March 2019 for the Recipient Site R3 (Figure 5.3)
and the weather conditions were summarized in Table 5.8. Seven (7)
translocated and nine (9) natural hard coral colonies were remained to monitor
after the typhoon Mangkhut in mid-September 2018. The general health conditions
(size, condition, mortality, bleaching and sediment) at Recipient Site were
recorded and summarized in Table 5.11 and Table 5.12
respectively. Photos of each tagged corals colonies were taken and shown in Appendix
F.
Table 5.8 Weather Condition for the 4th
Post-Translocation Monitoring during Construction Phase at Recipient Site R3
|
Date
|
Condition
|
Average Underwater
Visibility
|
|
28 March 2019
|
-
Northeast
force 3
-
Sunny period
|
Less than 0.5m
|
Table 5.9 Sizes, Condition,
Mortality, Bleaching and Sediment of 10 Natural Coral Colonies at Control Site of
Additional Monthly
Post-Re-tagging Monitoring (10 Jan 2019) and 1st
Quarterly Coral Monitoring (28 Mar 2019) during 7th to 9th Months Construction Phase
Monitoring
|
Coral #
|
Species
|
Size (cm) ¡V Max. Diameter
|
Condition
|
Mortality (%)
|
Bleaching (%)
|
Sediment (%)
|
|
Baseline
(26 Jun 2018 & 3
Dec 2018)
|
10 Jan 2019
|
28 Mar 2019
|
Baseline
(26 Jun 2018 & 3
Dec 2018)
|
10 Jan 2019
|
28 Mar 2019
|
Baseline
(26 Jun 2018 & 3
Dec 2018)
|
10 Jan 2019
|
28 Mar 2019
|
|
1
|
Goniopora stutchburyi
|
25
|
Fair
|
0
|
0
|
0
|
0
|
0
|
0
|
0
|
0
|
0
|
|
2R
|
Goniopora
stutchburyi
|
10
|
Good
|
0
|
0
|
0
|
0
|
0
|
0
|
0
|
0
|
0
|
|
3
|
Psammocora superficialis
|
18
|
Fair
|
0
|
0
|
0
|
0
|
0
|
0
|
0
|
0
|
0
|
|
4
|
Turbinaria peltata
|
13
|
Good
|
0
|
0
|
0
|
0
|
0
|
0
|
0
|
0
|
0
|
|
5R
|
Goniopora
stutchburyi
|
18
|
Good
|
0
|
0
|
0
|
0
|
0
|
0
|
0
|
0
|
0
|
|
6
|
Cyphastrea serailia
|
43
|
Fair
|
0
|
0
|
0
|
0
|
0
|
0
|
0
|
0
|
0
|
|
7R
|
Coscinaraea sp.
|
15
|
Good
|
0
|
0
|
0
|
0
|
0
|
0
|
0
|
0
|
0
|
|
8
|
Goniopora stutchburyi
|
21
|
Good
|
0
|
0
|
0
|
0
|
0
|
0
|
0
|
0
|
0
|
|
9
|
Goniopora stutchburyi
|
11
|
Fair
|
0
|
0
|
0
|
0
|
0
|
0
|
0
|
0
|
0
|
|
10R
|
Goniopora
stutchburyi
|
20
|
Good
|
0
|
0
|
0
|
0
|
0
|
0
|
0
|
0
|
0
|
Notes:
i.
The
re-tagged corals were marked as ##R.
Table 5.10 Sizes, Condition,
Mortality, Bleaching and Sediment of 10 Natural Coral Colonies at Indirect
Impact Site of Additional Monthly Post-Re-tagging Monitoring (10 Jan) and 1st
Quarterly Coral Monitoring (28 Mar) during 7th to 9th Months Construction Phase
Monitoring
|
Coral #
|
Species
|
Size (cm) ¡V Max. Diameter
|
Condition
|
Mortality (%)
|
Bleaching (%)
|
Sediment (%)
|
|
Baseline
(23 Nov 2018)
|
10 Jan 2019
|
28 Mar 2019
|
Baseline
(23 Nov 2018)
|
10 Jan 2019
|
28 Mar 2019
|
Baseline
(23 Nov 2018)
|
10 Jan 2019
|
28 Mar 2019
|
|
11R
|
Cyphastrea serailia
|
48
|
Good
|
0
|
0
|
0
|
0
|
0
|
0
|
0
|
0
|
0
|
|
12R
|
Favites
chinensis
|
27
|
Good
|
0
|
0
|
0
|
0
|
0
|
0
|
0
|
0
|
0
|
|
13R
|
Turbinaria
peltata
|
21
|
Good
|
0
|
0
|
0
|
0
|
0
|
0
|
0
|
0
|
0
|
|
14R
|
Favites chinensis
|
8
|
Good
|
0
|
0
|
0
|
0
|
0
|
0
|
0
|
0
|
0
|
|
15R
|
Goniopora
stutchburyi
|
11
|
Good
|
0
|
0
|
0
|
0
|
0
|
0
|
0
|
0
|
0
|
|
16R
|
Psammocora superficialis
|
27
|
Good
|
0
|
0
|
0
|
0
|
0
|
0
|
0
|
0
|
0
|
|
17R
|
Favites
chinensis
|
15
|
Good
|
0
|
0
|
0
|
0
|
0
|
0
|
0
|
0
|
0
|
|
18R
|
Psammocora superficialis
|
39
|
Good
|
0
|
0
|
0
|
0
|
0
|
0
|
0
|
0
|
0
|
|
19R
|
Psammocora superficialis
|
42
|
Good
|
0
|
0
|
0
|
0
|
0
|
0
|
0
|
0
|
0
|
|
20R
|
Psammocora
superficialis
|
29
|
Good
|
0
|
0
|
0
|
0
|
0
|
0
|
0
|
0
|
0
|
Notes:
i.
The
re-tagged corals were marked as ##R.
Table 5.11 Sizes,
Condition, Mortality, Bleaching and Sediment of 7 Translocated Coral Colonies
at Recipient Site for all Post-Translocation Coral Monitoring
|
Coral
#
|
Species
|
Size
(cm) ¡V Max. Diameter/
Height
|
Mortality
(%)
|
Bleaching
(%)
|
Sediment
(%)
|
|
Baseline
23 & 24 Mar 18
|
1st
26 Jun 18
|
2nd
20 Sep 18
|
3rd
03 Dec 18
|
4th
28 Mar 19
|
Baseline
23 & 24 Mar 18
|
1st
26 Jun 18
|
2nd
20 Sep 18
|
3rd
03 Dec 18
|
4th
28 Mar 19
|
Baseline
23 & 24 Mar 18
|
1st
26 Jun 18
|
2nd
20 Sep 18
|
3rd
03 Dec 18
|
4th
28 Mar 19
|
|
1
|
Psammocora
superficialis
|
35
|
0
|
0
|
15**
|
15**
|
15**
|
0
|
0
|
0
|
0
|
0
|
0
|
0
|
0
|
0
|
0
|
|
2
|
Psammocora
superficialis
|
N/A
|
0
|
0
|
N/A
|
N/A
|
N/A
|
0
|
0
|
N/A
|
N/A
|
N/A
|
0
|
0
|
N/A
|
N/A
|
N/A
|
|
3
|
Psammocora
superficialis
|
N/A
|
0
|
0
|
N/A
|
N/A
|
N/A
|
0
|
0
|
N/A
|
N/A
|
N/A
|
0
|
0
|
N/A
|
N/A
|
N/A
|
|
4
|
Turbinaria peltata
|
9
|
0
|
0
|
10**
|
10**
|
10**
|
0
|
0
|
0
|
0
|
0
|
0
|
0
|
0
|
0
|
0
|
|
5
|
Goniopora
stutchburyi
|
N/A
|
0
|
0
|
N/A
|
N/A
|
N/A
|
0
|
0
|
N/A
|
N/A
|
N/A
|
0
|
0
|
N/A
|
N/A
|
N/A
|
|
6
|
Psammocora
superficialis
|
26
|
0
|
0
|
15**
|
15**
|
15**
|
0
|
0
|
0
|
0
|
0
|
0
|
0
|
0
|
0
|
0
|
|
7
|
Psammocora
superficialis
|
23
|
0
|
0
|
5**
|
5**
|
5**
|
0
|
0
|
0
|
0
|
0
|
5
|
0
|
0
|
0
|
0
|
|
8
|
Psammocora
superficialis
|
N/A
|
0
|
0
|
N/A
|
N/A
|
N/A
|
0
|
0
|
N/A
|
N/A
|
N/A
|
0
|
0
|
N/A
|
N/A
|
N/A
|
|
9
|
Goniopora
stutchburyi
|
N/A
|
0
|
0
|
N/A
|
N/A
|
N/A
|
0
|
0
|
N/A
|
N/A
|
N/A
|
0
|
0
|
N/A
|
N/A
|
N/A
|
|
10
|
Coscinaraea n sp.
|
21
|
0
|
0
|
5**
|
5**
|
5**
|
0
|
0
|
0
|
0
|
0
|
1
|
0
|
0
|
0
|
0
|
|
11
|
Psammocora
superficialis
|
13
|
0
|
0
|
0
|
0
|
0
|
0
|
0
|
0
|
0
|
0
|
0
|
0
|
0
|
0
|
0
|
|
12
|
Psammocora
superficialis
|
N/A
|
0
|
0
|
N/A
|
N/A
|
N/A
|
0
|
0
|
N/A
|
N/A
|
N/A
|
0
|
0
|
N/A
|
N/A
|
N/A
|
|
13
|
Psammocora
superficialis
|
N/A
|
0
|
0
|
N/A
|
N/A
|
N/A
|
0
|
0
|
N/A
|
N/A
|
N/A
|
0
|
0
|
N/A
|
N/A
|
N/A
|
|
14
|
Psammocora
superficialis
|
N/A
|
0
|
0
|
N/A
|
N/A
|
N/A
|
0
|
0
|
NA
|
NA
|
NA
|
0
|
0
|
NA
|
NA
|
NA
|
|
15
|
Goniopora
stutchburyi
|
N/A
|
0
|
0
|
N/A
|
N/A
|
N/A
|
0
|
0
|
N/A
|
N/A
|
N/A
|
0
|
0
|
N/A
|
N/A
|
N/A
|
|
16
|
Psammocora
superficialis
|
26
|
0
|
0
|
10**
|
10**
|
10**
|
0
|
0
|
N/A
|
N/A
|
N/A
|
0
|
0
|
N/A
|
N/A
|
N/A
|
* N/A: Non Applicable as coral
colonies were missing.
** Increased
mortality was found after the hitting of super typhoon Mangkhut in
Mid-September 2018.
Table 5.12 Sizes,
Condition, Mortality, Bleaching and Sediment of 9 Natural Coral Colonies at
Recipient Site for all Post-Translocation Coral Monitoring
|
Coral
#
|
Species
|
Size
(cm) ¡V Max. Diameter/
Height
|
Mortality
(%)
|
Bleaching
(%)
|
Sediment
(%)
|
|
Baseline
23 & 24 Mar 18
|
1st
26 Jun 18
|
2nd
20 Sep 18
|
3rd
03 Dec 18
|
4th
28 Mar 19
|
Baseline
23 & 24 Mar 18
|
1st
26 Jun 18
|
2nd
20 Sep 18
|
3rd
03 Dec 18
|
4th
28 Mar 19
|
Baseline
23 & 24 Mar 18
|
1st
26 Jun 18
|
2nd
20 Sep 18
|
3rd
03 Dec 18
|
4th
28 Mar 19
|
|
1
|
Coscinaraea
n sp.
|
16
|
0
|
0
|
0
|
0
|
0
|
0
|
0
|
0
|
0
|
0
|
0
|
0
|
0
|
0
|
0
|
|
2
|
Psammocora
superficialis
|
24
|
0
|
0
|
0
|
0
|
0
|
0
|
0
|
0
|
0
|
0
|
0
|
0
|
0
|
0
|
0
|
|
3
|
Psammocora
superficialis
|
23
|
0
|
0
|
0
|
0
|
0
|
0
|
0
|
0
|
0
|
0
|
0
|
0
|
0
|
0
|
0
|
|
4
|
Coscinaraea
n sp.
|
15
|
0
|
0
|
0
|
0
|
0
|
0
|
0
|
0
|
0
|
0
|
0
|
0
|
0
|
0
|
0
|
|
5
|
Cyphastrea
serailia
|
42
|
0
|
0
|
0
|
0
|
0
|
0
|
0
|
0
|
0
|
0
|
0
|
0
|
0
|
0
|
0
|
|
6
|
Cyphastrea
serailia
|
12
|
0
|
0
|
0
|
0
|
0
|
0
|
0
|
0
|
0
|
0
|
0
|
0
|
0
|
0
|
0
|
|
7
|
Cyphastrea
serailia
|
46
|
0
|
0
|
0
|
0
|
0
|
0
|
0
|
0
|
0
|
0
|
0
|
0
|
0
|
0
|
0
|
|
8
|
Psammocora
superficialis
|
21
|
0
|
0
|
0
|
0
|
0
|
0
|
0
|
0
|
0
|
0
|
0
|
0
|
0
|
0
|
0
|
|
9
|
Psammocora
superficialis
|
19
|
0
|
0
|
0
|
0
|
0
|
0
|
0
|
0
|
0
|
0
|
0
|
0
|
0
|
0
|
0
|
|
10
|
Goniopora stutchburyi
|
N/A
|
0
|
0
|
N/A
|
N/A
|
N/A
|
0
|
0
|
N/A
|
N/A
|
N/A
|
0
|
0
|
N/A
|
N/A
|
N/A
|
* N/A: Non Applicable as coral colonies were missing.
6.
Marine Mammal
6
6.1
Survey
Methods
6.1.1
Vessel-based Line-transect Survey
For the
vessel-based marine mammal surveys, the monitoring team adopted the standard
line-transect method (Buckland et al. 2001) as same as that adopted during the
EIA study and pre-construction phase monitoring to allow fair comparison of
marine mammal monitoring results.
Eight
transect lines are set at Southeast Lantau survey area, including Shek Kwu
Chau, waters between Shek Kwu Chau and the Soko Islands, inshore waters of
Lantau Island (e.g. Pui O Wan) as well as southwest corner of Cheung Chau as
shown in Figure 6.1 below:
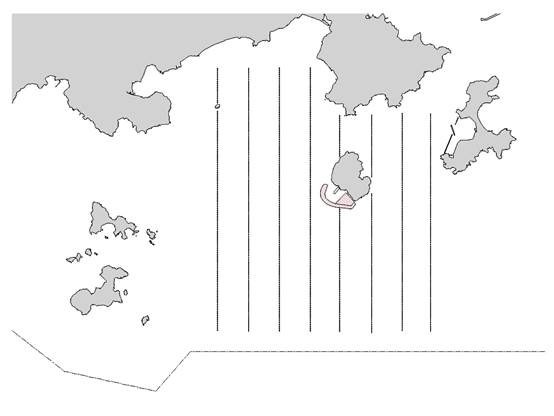
|
|
Figure 6.1 Line Transects for Marine Mammal Surveys
|
In comparison
to the baseline monitoring results, results from the analyzed construction
phase monitoring data would allow the detection of any changes of their usage
of habitat, in response to the scheduled construction works.
6.2
Specific
Mitigation Measures
6.2.1
Monitored exclusion zones
During the
installation/re-installation/relocation process of floating type silt curtains,
in order to avoid the accidental entrance and entrapment of marine mammals
within the silt curtains, a monitored exclusion zone of 250 m radius from silt
curtain should be implemented and monitored by competent Marine Mammal
Observers (MMOs). Marine Mammal Exclusion Zone (MMEZ) would also be implemented
for precautionary purpose for DCM works.
6.2.2
Marine mammal watching plan
Upon the
completion of silt curtain installation/re-installation/relocation, marine
mammal watching plan would be implemented to observe
the presence of any marine mammal around the localized silt curtain or being
trapped by the localized silt curtain.
6.3
Results
and Observations
6.3.1
Vessel-based Line-transect Survey
Six monthly
surveys were conducted during the reporting period. As this is covering within
the peak season (December - May) while two surveys were completed in each month
during peak season. A total on effort (transects only) survey length of 246.3 km
was completed, 199.5 km at Beaufort Sea State 2 or better (Table 6.1). Sixteen
(16) Finless Porpoise sightings and one (1) Chinese White Dolphin sighting were
recorded, twelve (12) ¡§on effort¡¨ and five (5) while
transiting between transect lines (referred to as secondary line in AFCD
reports; and the details
of recorded sightings were summarized (Table 6.2, Figure 6.2).
Table 6.1 Summary of Vessel-based Line-transect
Survey Effort
|
Date
|
Area*
|
Beaufort
|
Effort (km)
|
Season
|
Vessel
|
Effort Type**
|
|
14-01-19
|
SEL
|
1
|
7.4
|
WINTER
|
SMRUHK
|
P
|
|
14-01-19
|
SEL
|
2
|
14.1
|
WINTER
|
SMRUHK
|
P
|
|
14-01-19
|
SEL
|
3
|
17.6
|
WINTER
|
SMRUHK
|
P
|
|
31-01-19
|
SEL
|
1
|
35.4
|
WINTER
|
SMRUHK
|
P
|
|
31-01-19
|
SEL
|
2
|
5.2
|
WINTER
|
SMRUHK
|
P
|
|
12-02-19
|
SEL
|
1
|
18.3
|
WINTER
|
SMRUHK
|
P
|
|
12-02-19
|
SEL
|
2
|
14.8
|
WINTER
|
SMRUHK
|
P
|
|
12-02-19
|
SEL
|
3
|
8.1
|
WINTER
|
SMRUHK
|
P
|
|
26-02-19
|
SEL
|
1
|
6.6
|
WINTER
|
SMRUHK
|
P
|
|
26-02-19
|
SEL
|
2
|
18.5
|
WINTER
|
SMRUHK
|
P
|
|
26-02-19
|
SEL
|
3
|
16.4
|
WINTER
|
SMRUHK
|
P
|
|
18-03-19
|
SEL
|
1
|
9.0
|
SPRING
|
SMRUHK
|
P
|
|
18-03-19
|
SEL
|
2
|
29.2
|
SPRING
|
SMRUHK
|
P
|
|
18-03-19
|
SEL
|
3
|
4.2
|
SPRING
|
SMRUHK
|
P
|
|
28-03-19
|
SEL
|
1
|
41.5
|
SPRING
|
SMRUHK
|
P
|
* As
shown in Figure. 6.1
** P
(from AFCD) denotes the ON EFFORT survey on the transect line, not the
adjoining passages
Table 6.2 Summary of Sightings Recorded during
January 2019 to March 2019 of Vessel-based Line-transect Survey Effort
|
Date
|
Species
|
Sighting No.
|
Group Size
|
PSD
|
Behaviour
|
Latitude
|
Longitude
|
Area
|
Effort Type
|
Season
|
|
14-01-19
|
Finless Porpoise
|
7
|
1
|
N/A
|
Unknown
|
22.1757
|
113.948
|
SEL
|
OFF
|
WINTER
|
|
31-01-19
|
Finless Porpoise
|
8
|
2
|
N/A
|
Travel
|
22.1635
|
113.9521
|
SEL
|
OFF
|
WINTER
|
|
31-01-19
|
Finless Porpoise
|
9
|
1
|
79
|
Travel
|
22.1726
|
113.9736
|
SEL
|
ON
|
WINTER
|
|
31-01-19
|
Chinese White Dolphin
|
10
|
2
|
139
|
Feeding
|
22.2197
|
113.9748
|
SEL
|
ON
|
WINTER
|
|
31-01-19
|
Finless Porpoise
|
11
|
2
|
0
|
Travel
|
22.1774
|
113.9933
|
SEL
|
ON
|
WINTER
|
|
31-01-19
|
Finless Porpoise
|
12
|
1
|
0
|
Unknown
|
22.1917
|
114.0126
|
SEL
|
ON
|
WINTER
|
|
12-02-19
|
Finless Porpoise
|
13
|
3
|
22
|
Travel
|
22.1882
|
113.9535
|
SEL
|
ON
|
WINTER
|
|
12-02-19
|
Finless Porpoise
|
14
|
2
|
N/A
|
Travel
|
22.2002
|
113.9782
|
SEL
|
OFF
|
WINTER
|
|
12-02-19
|
Finless Porpoise
|
15
|
3
|
20
|
Unknown
|
22.2173
|
113.9543
|
SEL
|
ON
|
WINTER
|
|
26-02-19
|
Finless Porpoise
|
16
|
4
|
N/A
|
Travel
|
22.2021
|
113.9831
|
SEL
|
OFF
|
WINTER
|
|
26-02-19
|
Finless Porpoise
|
17
|
2
|
N/A
|
Travel
|
22.1910
|
113.9758
|
SEL
|
OFF
|
WINTER
|
|
18-03-19
|
Finless Porpoise
|
18
|
1
|
20
|
Travelling
|
22.21253
|
113.9837
|
SEL
|
ON
|
SPRING
|
|
28-03-19
|
Finless Porpoise
|
19
|
4
|
33
|
Travelling
|
22.18111
|
113.9451
|
SEL
|
ON
|
SPRING
|
|
28-03-19
|
Finless Porpoise
|
20
|
3
|
27
|
Travelling
|
22.17312
|
113.9452
|
SEL
|
ON
|
SPRING
|
|
28-03-19
|
Finless Porpoise
|
21
|
2
|
126
|
Travelling
|
22.17532
|
113.9542
|
SEL
|
ON
|
SPRING
|
|
28-03-19
|
Finless Porpoise
|
22
|
1
|
121
|
Travelling
|
22.18774
|
113.9623
|
SEL
|
ON
|
SPRING
|
|
28-03-19
|
Finless Porpoise
|
23
|
2
|
20
|
Feeding
|
22.17603
|
113.9837
|
SEL
|
ON
|
SPRING
|
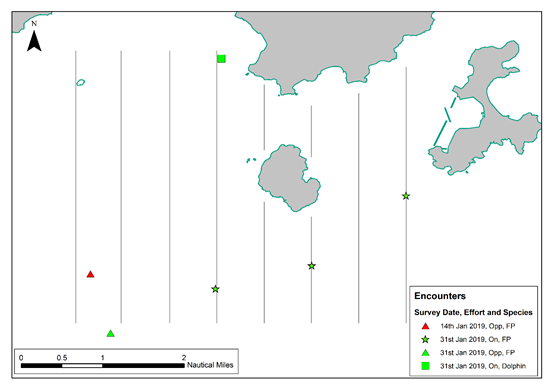
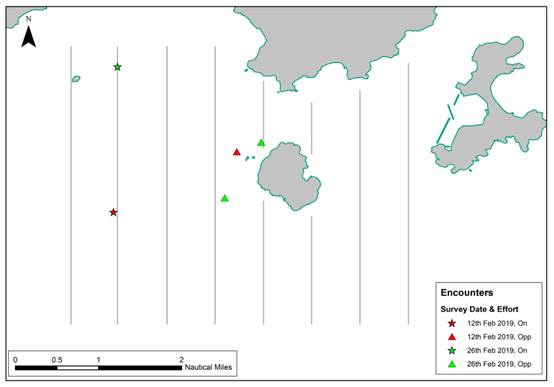
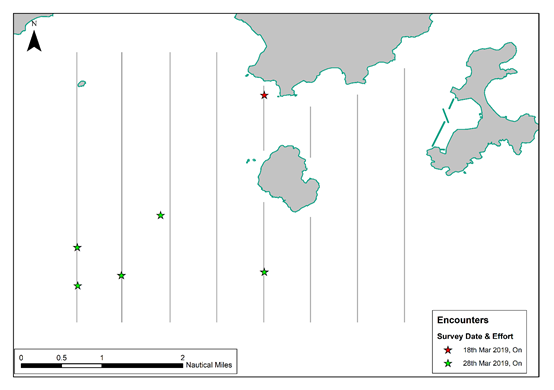
Figure 6.2 Location
of sightings recorded during January to March 2019
Vessel-based Line-transect Survey
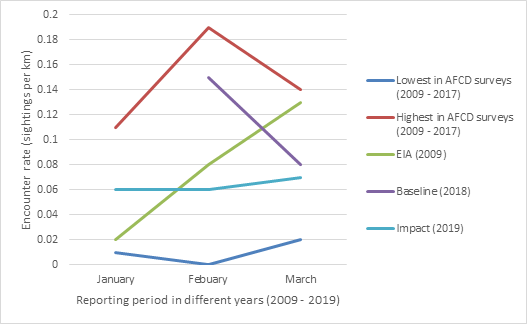
Figure 6.3 Plot
of encounter rate during January to March in 2009 ¡V 2019 from different surveys
A review of the long term AFCD marine
mammal monitoring programme, the EIA and the pre-construction baseline
monitoring report for this project was conducted. Both the EIA and the
pre-construction baseline monitoring were conducted during the peak porpoise
months (Dec 2008 to May 2009 and Feb-April 2018, respectively. The AFCD long term monitoring data, the EIA and baseline information
could be compared directly to Impact Survey results of the reporting period.
A review
of the Beaufort Sea state survey conditions between 2009 and 2018 (only data
available from AFCD at time of writing; (AFCD 2018; 2017; 2016; 2015; 2014;
2013; 2012; 2011; 2010)) shows that survey conditions in January to March 2019
were within the % limits of previous AFCD surveys,
and much better than surveys conducted during the EIA.
A review
of all the porpoise sightings in the survey area for January to March between
2009-2018 indicates that there are fluctuations between the number of sightings
usually recorded in January to March. Given the similar survey conditions and
the encounter rate recorded for porpoise in the project area during the
reporting period, the encounter rate for January to March 2019 were 0.06km-1,
0.06km-1 and 0.07km-1 respectively (see Figure 6.3),
it is noted that the encounter rate of impact survey lied at the approximate a half of the baseline survey for February survey. It highlighted
the inherent variability for surveys that focused on relatively small
populations of highly mobile individuals. When comparing on March survey
results, the encounter rate in March 2019 impact survey was approximately the
same as the March 2018 baseline survey. Such extremely low encounter rates
during the reporting period in a small part of the finless porpoise habitat,
significant differences in sightings might be impossible to calculate.
It is
difficult to draw conclusions with regards to impacts on marine mammals as
predicted in the EIA and the effectiveness of project mitigation measures during
the initial phase of construction activities. As surveys continue for this
project, data shall be constantly re-evaluated across survey months to discern
trends and impacts, if any.
6.3.2
Specific Mitigation Measures
Silt
curtains were deployed for sand blanket laying works and DCM trial during the
reporting period. At least two MMO were on duty for continuous monitoring of
the Marine Mammal Exclusion Zone (MMEZ) for DCM trial works and
installation/re-installation/relocation process of silt curtains, and the
marine mammal trapping checking and silt curtains inspection in accordance with
the Detailed Monitoring Programme of Finless Porpoise and Marine Mammal
Watching Plan respectively. Trainings for the MMO were provided by the ET prior
to the aforementioned works, with a cumulative total of 63 individuals being
trained and the training records kept by the ET. From the Marine Mammal
Watching observation records and MMEZ monitoring log records, no Finless
Porpoise or other marine mammals were observed within or around the MMEZ and
silt curtains in the reporting month.
6.3.3
PAM and Land-based
Theodolite Tracking
These tracking surveys will be conducted during
the peak season between December 2018 and May 2019 for 30 surveys during the
peak season to provide good temporal coverage during the initial stage of the
construction period.
Theodolite surveys were conducted on 21/02, 22/02,
28/02, 01/03, 04/03, 05/03, 06/03, 12/03, 13/03, 15/03, 20/03, 21/03, 22/03, 26/03,
27/03 and 29/03. Five to six hours of monitoring were conducted each day. As
anticipated, site barges obstructed much of the immediate view. Theodolite data
shall be analysed at the end of the survey period, as per the format and
analyses procedures presented in the baseline report for this project.
6.3.4
Photo records of the marine mammal monitoring
taken during the reporting period are presented in Appendix G.
7.
White-Bellied Sea Eagle
7
7.1
WBSE
Monitoring Parameters
7.1.1
Information to be collected included feeding,
perching/roosting, preening, soaring, flying, nesting and territorial guarding
and the time spent on each activity. The responses and reactions to any
disturbance to the WBSEs were also recorded and examined in conjunction with
the construction noise and/or other events in the vicinity. Other disturbances
such as weather condition, or invasion by other fauna species were also
recorded.
7.2
Results
and Observations
7.2.1
Six monitoring for monthly construction phase were
conducted during the reporting period. Since there is no landing point along the western part of SKC,
boat survey was used for the monitoring survey. In order to increase the chance
of finding the WBSEs, monitoring survey was carried out either early in the morning
or later in the afternoon. The weather conditions of monitoring survey were
shown in Table 7.1.
Table 7.1 Weather Conditions during the WBSE Monitoring (Monthly)
|
Date
|
Condition
|
Temperature (¢J)
|
|
9 January 2019
|
-
Northeast
5 to 6
-
Sunny
|
23
|
|
30 January 2019
|
-
Northeast
force 3 to 4
-
Sunny
|
25
|
|
16 February 2019
|
-
Northeast
3 to 4
-
Sunny
|
26
|
|
27 February 2019
|
-
North
4 to 5
-
Sunny
|
25
|
|
20 March 2019
|
-
East
force 3 to 4
-
Sunny
|
25
|
|
31 March
2019
|
-
Southeast
force 4 to 5
-
Sunny
|
27
|
7.2.2
Since a chick WBSE was recorded in the
monitoring survey on 20 March 2019, in accordance with
Updated EM&A Manual, 7 consecutive daily monitoring during the first week
of nestling period was started to conduct on 21 March 2019 and finished at 27
March 2019. Since there is no landing point along the western part of SKC, boat
survey was used for the monitoring survey. In order to increase the chance of
finding the WBSEs, monitoring survey was carried out early in the morning. The
weather conditions of monitoring survey were shown in Table 7.2
Table 7.2 Weather Conditions during the
WBSE Monitoring (7 consecutive daily)
|
Date
|
Condition
|
Temperature (¢J)
|
|
21 March 2019
|
-
Southeast
force 3 to 4
-
Sunny
|
22
|
|
22 March 2019
|
-
Southeast
force 4 to 5
-
Sunny
|
24
|
|
23 March 2019
|
-
Southeast
force 4 to 5
-
Sunny
|
26
|
|
24 March 2019
|
-
East
force 4 to 5
-
Sunny
|
23
|
|
25 March 2019
|
-
East
force 4 to 5
-
Sunny
|
24
|
|
26 March 2019
|
-
Southeast
force 3 to 4
-
Sunny
|
25
|
|
27 March 2019
|
-
Southeast
force 3
-
Sunny
|
28
|
7.2.3
Two WBSE adults were recorded during each survey
and appeared flying over SKC Island, standing on the
tree top on SKC Island during the survey in January to March 2019. In the March 2019 monitoring survey, one chick was observed and
staying inside the nest.
7.2.4
Any disturbances from anthropogenic activities
on the island were not recorded during the monitoring surveys. However, fishing
boats moving close to the shore were recorded. Since the nest is about 160m
away from the shore and it is not accessible, fishing boat activities didn¡¦t
show any direct disturbance to the WBSE nest.
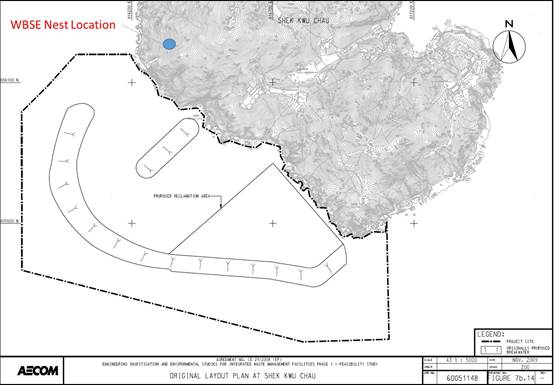
Figure 7.1 Location of WBSE Nest on SKC
7.2.5
No invasion of other fauna species was recorded
and no sign of using the construction site as a foraging ground was recorded as
well.
7.2.6
During the reporting period, no abnormal
behaviour of the recorded adults was shown. All marine works during the seventh
to ninth months construction period did not show any influence to the WBSE.
7.2.7
Photo records of the WBSE taken during the
reporting period are presented in Appendix H.
8.
Summary of Monitoring Exceedance, Complaints,
Notification of Summons and Prosecutions
8
8.1
No
exceedance of the Action and Limit Levels of the regular construction noise, coral
and WBSE monitoring was recorded during the reporting period.
8.2
For general
& regular DCM water monitoring, thirty-nine (39) & twenty-four (24) of
the water quality monitoring results for Suspended Solid (SS) obtained during
the reporting period had exceeded the relevant Action and Limit Levels
respectively. Thirteen (13) & twenty (20) of the water quality monitoring
results for SS reported during January 2019, four (4) & one (1) of the
water quality monitoring results for SS reported during February 2019 and twenty-two
(22) & three (3) of the water quality monitoring results for SS reported
during March 2019. For initial intensive DCM water monitoring, thirty (30)
& ninety (90) of the water quality monitoring results for Suspended Solid
(SS) obtained during the reporting period had exceeded the relevant Action and
Limit Levels respectively. Twenty-four (24) & sixty-two (62) of the water
quality monitoring results for SS reported during February 2019 and six (6) and
twenty-eight (28) of the water quality monitoring results for SS reported
during March 2019.
8.3
Findings
from investigations carried out immediately for each of the exceedance cases
during the reporting period had showed that these exceedances were unrelated to
the Project,
however, environmental deficiencies of the Contractor on the implementation of
silt curtain deployment system were spotted.
8.4
Further
investigation was made with the Contractor on the silt curtain design and
checking procedure as stated in the deposited Silt Curtain Deployment Plan.
Rectification actions regarding to the improper implementation of silt curtain
system shall be carried out immediately.
8.5
The
Contractor has been reminded that all measures recommended in the deposited
Silt Curtain Deployment Plan shall be fully and properly implemented for the
Project as per Clause 2.6A of the FEP.
8.6
The
Contractor has been reminded to facilitate the ET¡¦s investigation in the time
frame stated at Event and Action plan under the updated EM&A Manual by
promptly providing site records and information.
8.7
No
notification of summons and prosecution was received in the reporting period.
8.8
Statistics
on complaints, notifications of summons and successful prosecutions are
summarized in Appendix I.
9.
EM&A Site Inspection
9
9.1
Site
inspections were carried out on a weekly basis to monitor the implementation of
proper environmental pollution control and mitigation measures under the
Contract. Site inspections were carried out at the Site Portions 1, 1A & 1B
and Portion 7 during the reporting period. Portions 1, 1A & 1B were the
sites near SKC within the Site boundary and Portion 7 was the site at Tung
Chung for stockpiling of construction materials.
9.2
Joint
site inspection with IEC was carried out on a monthly basis.
9.3
Minor
deficiencies were observed during weekly site inspection. Key observations
during the site inspections are summarized below:
¡P
Site
tidiness were not maintained properly
¡P
Prevention
actions for oil/chemical spillage were not carried out properly
¡P
Silt
curtains were not deployed properly
¡P
Damage
of deployed silt curtains was found
¡P
Sand
was accumulated on the pontoon¡¦s surface
9.4
The
Contractor has rectified most of the observations identified during environmental
site inspections in the reporting period.
9.5
During
site inspection, installed silt curtain were found damaged for some idling
works. The contractor was reminded to properly fix and maintain the deployed
silt curtains prior to the operation of concerned construction works during the
site walk by ET and IEC. The Contractor conducted the maintenance of deployed silt
curtain immediately before resuming any construction works.
9.6
According
to the EIA Study Report, Environmental Permit, contract documents and Updated EM&A
Manual, the mitigation measures detailed in the documents, except the silt
curtain system, are implemented as much as practical during the reporting
period. An updated Implementation Status of Environmental Mitigation Measures
(EMIS) is provided in Appendix B.
10. Conclusion
and Recommendations
10
10.1
This
3rd Quarterly Environmental Monitoring and Audit (EM&A) Report summarizes
the EM&A works undertaken during the period from 1 January 2019 to 31 March
2019 in accordance with the Updated EM&A Manual and the requirement under
EP- 429/2012/A and FEP-01/429/2012/A.
10.2
Construction
noise, water quality, construction waste, coral, marine mammal and
White-Bellied Sea Eagle (WBSE) monitoring were carried out in the reporting
period. No project-related exceedance of the Action and Limit Level was
recorded during the reporting period,
however, environmental deficiencies of the Contractor on the implementation of
silt curtain deployment system were spotted.
10.3
Weekly
environmental site inspection was conducted during the reporting period. Environmental
deficiencies were observed during site inspection and were rectified.
10.4
The
Contractor has been reminded to facilitate the ET¡¦s investigation in the time
frame stated at Event and Action plan under the updated EM&A Manual by
promptly providing site records and information.
10.5
According
to the environmental site inspections performed in the reporting period, the
Contractor is reminded to pay attention on maintaining site tidiness and
avoidance of oil spillage on-site and sand accumulation on the pontoon surface
during sand blanket laying works.
10.6
Regarding
to the deployment of silt curtains as a principal water quality impact
mitigation measures on various marine works, the Contractor has been reminded
to follow strictly to the design and checking procedure as specified in the
Silt Curtain Deployment Plan. As the scale of DCM works will be stepped up in
the coming months, the Contractor has been reminded to pay extra attention on
the status of deployed silt curtain. The Contractor is reminded that all
measures recommended in the deposited silt curtain deployment plan shall be
fully and properly implemented for the Project as per EP condition 2.6 of the
FEP.
10.7
As
the dredging works was conducted in the reporting period, the Contractor had
been reminded to follow strictly to the design and checking procedure as
specified in the Silt Curtain Deployment Plan for the dredging works. The
Contractor had been reminded to follow the regulation on rate and means for
dredging works as stipulated in FEP Clause 2.17 ¡V 2.21. The Contractor is
reminded to follow Dumping At Sea Ordinance (DASO) for the storage, handling
and disposal of dredged materials.
10.8
No
environmental complaint was received in the reporting period.
10.9
No
notification of summons or prosecution was received since commencement of the
Contract.
10.10 The ET will keep track
on the construction works to confirm compliance of environmental requirements
and the proper implementation of all necessary mitigation measures.