Revision History
|
C |
Updated Appendix D |
8 March 2024 |
|
B |
Revision based on EPD and AFCD¡¦s comment |
15 May 2019 |
|
A |
First Submission |
31 January 2018 |
|
Rev. |
Description of Modification |
Date |
Content
2. Marine Water Quality Monitoring
8 Summary of Monitoring Exceedance, Complaints, Notification of Summons and Prosecutions
10. Conclusion and Recommendations
Appendix A |
|
|
Appendix B |
Summary of Implementation Status of Environmental Mitigation |
|
Appendix C |
|
|
Appendix D |
|
|
Appendix E |
|
|
Appendix F |
|
|
Appendix G |
|
|
Appendix H |
|
|
Appendix I |
Executive Summary
A1. The Project, Integrated Waste Management Facility (IWMF), is a Designated Project under the Environmental Impact Assessment Ordinance (Cap. 499) (EIAO) and is currently governed by a Further Environmental Permit (FEP No. FEP-01/429/2012/A) for the construction and operation of the Project.
A2. In accordance with the Updated Environmental Monitoring and Audit (EM&A) Manual for the Project, EM&A works for marine water quality, noise, waste management and ecology should be carried out by Environmental Team (ET), Acuity Sustainability Consulting Limited (ASCL), during the construction phase of the Project.
A3. This is the 2nd Quarterly EM&A Report, prepared by ASCL, for the Project summarizing and concluding the monitoring results and audit findings of the EM&A programme at and around Shek Kwu Chau (SKC) during the reporting period from 1 October 2018 to 31 December 2018.
A4. The EM&A works for construction noise, water quality, construction waste, coral, marine mammal and White-Bellied Sea Eagle (WBSE) were conducted during the reporting period in accordance with the Updated EM&A Manual.
A5. Weekly site inspections of the construction works were carried out by ET to audit the mitigation measures implementation status. Monthly joint site inspections were carried out by ET and IEC.
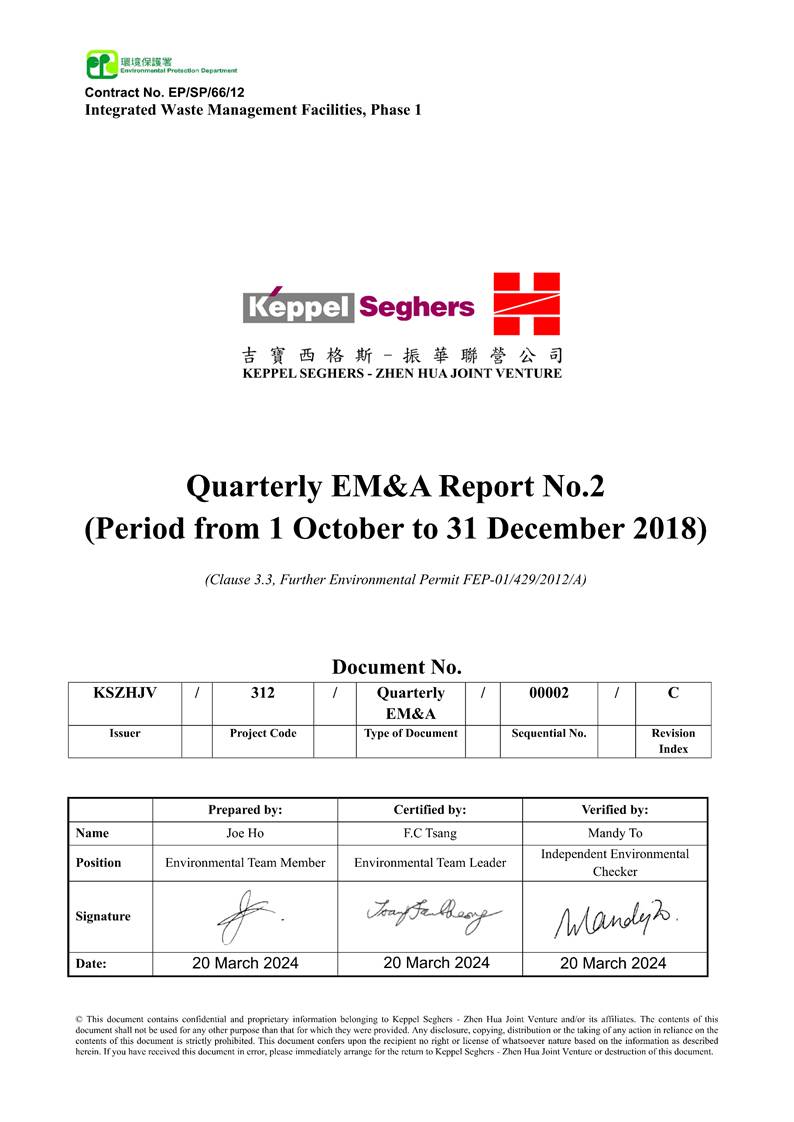
1. Basic Project Information 1.1 The Reporting Scope 1.1.1 This is the 2nd Quarterly EM&A Report for the Project which summarizes the key findings of the EM&A programme during the reporting period from 1 October 2018 to 31 December 2018. 1.2 Project Organization 1.2.1 The Project Organization structure for Construction Phase is presented in Figure 1.1. 1.2.2 Contact details of the key personnel are presented in Table 1.1 below:
Table 1.1 Contact Details of Key Personnel
|
Party |
Position |
Name |
Telephone no. |
|
Environmental Protection Department |
Project Proponent |
Cheng Tak-Kuen |
2594-6111 |
|
Keppel Seghers ¡V Zhen Hua Joint Venture |
Project Manager |
Kenny Yu |
2192-0606 |
|
Acuity Sustainability Consulting Limited |
Environmental Team Leader |
Robin Ho |
2698-6833 |
|
ERM-Hong Kong, Limited |
Independent Environmental Checker |
Mandy To |
2271-3000 |
Table 1.2 Summary of the Construction Activities Undertaken during the Reporting Period
|
Location of works |
Construction activities undertaken |
Remarks on progress |
|
¡P Marine site investigation works |
¡P 56 out of 62 drill holes were completed |
|
|
Location of DCM Site Trial |
¡P Coring of DCM samples |
¡P Completed |
|
Location of Static Loading Test |
¡P Laying of geotextile and sand blanket |
¡P Completed |
|
Seawall locations |
¡P Collecting of Marine Sediment Samples |
¡P Completed |
|
Location of DCM Static Loading Test |
¡P DCM installation |
¡P Completed |
|
Seawall and breakwater locations |
¡P Laying of Geotextile and Sand Blanket |
¡P 42 out of 48 geotextiles were laid ¡P On-going for sand blanket laying |
|
Seawall and berth area |
¡P DCM installation |
¡P On-going |
Table 1.3 Summary of Status for Key Environmental Aspects under the Updated EM&A Manual
1.3.3 Other than the EM&A works by ET, environmental briefings, trainings and regular environmental management meetings were conducted, in order to enhance environmental awareness and closely monitor the environmental performance of the contractors. 1.3.4 The EM&A programme has been implemented in accordance with the recommendations presented in the approved EIA Report and the Updated EM&A Manual. A summary of updated implementation status of the environmental mitigation measures for the construction phase of the Project during the reporting period is provided in Appendix B.
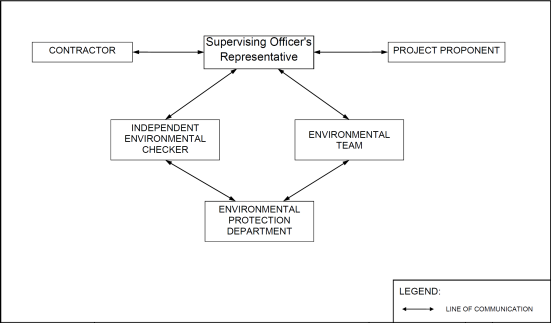
2. Marine Water Quality Monitoring 2.1 Water Quality Parameters 2.1.1 Measurement of Dissolved Oxygen (DO), Turbidity, Suspended Solids (SS), Salinity and pH have been undertaken at eleven monitoring stations during general water quality monitoring. Besides the above parameters, monitoring of Total Alkalinity, Current Velocity and Current Direction have been undertaken at all fourteen monitoring stations (including S1, S2 and S3) during regular DCM monitoring. 2.1.2 Current velocity and direction, DO, temperature, salinity, turbidity and pH were measured in-situ and the SS, Total Alkalinity were assayed in a HOKLAS laboratory. 2.1.3 In associate with the water quality parameters, other relevant data were also measured, such as monitoring location/position, time, water depth, sampling depth, tidal stages, weather conditions and any special phenomena or work underway nearby were also recorded. 2.1.4 Table 2.1 summarizes the monitoring parameters, frequency and duration of the impact water quality monitoring.
Table 2.1 Water Quality Monitoring Parameters, Frequency and Duration
|
Parameter, unit |
Frequency |
No. of Depths |
|
¡P Water Depth(m) ¡P Temperature(oC) ¡P Salinity(ppt) ¡P pH (pH unit) ¡P Dissolved Oxygen (DO)(mg/L and % of saturation) ¡P Turbidity(NTU) ¡P Suspended Solids (SS), mg/L ¡P Total alkalinity ¡P Current velocity ¡P Direction |
Impact monitoring: 3 days per week, at mid-flood and mid-ebb tides
|
3 water depths: 1m below sea surface, mid-depth and 1m above sea bed. If the water depth is less than 3m, mid-depth sampling only. If water depth is less than 6m, mid-depth may be omitted.
|
|
|
Figure 2.1 Water monitoring locations at Artificial Island near SKC |
Table 2.2 Derived Action and Limit Levels for Water Quality Monitoring
|
Parameters |
Action |
Limit |
|
Construction Phase Impact Monitoring |
||
|
DO in mg/L |
≤ 7.13 |
≤ 4 |
|
SS in mg/L |
≥ 8 or 120% of control station¡¦s SS at the same tide of the same day of measurement, whichever is higher |
≥ 10 or 130% of control station's SS at the same tide of the same day of measurement, whichever is higher |
|
Turbidity in NTU |
≥ 5.6 or 120% of control station¡¦s turbidity at the same tide of the same day of measurement, whichever is higher |
≥ 12.81 or 130% of control station's turbidity at the same tide of the same day of measurement, whichever is higher |
|
Temperature in¢XC |
1.8¢XC above the temperature recorded at representative control station at the same tide of the same day |
2¢XC above the temperature recorded at representative control station at the same tide of the same day |
|
Total Alkalinity in mg/L |
≥116 or 120% of control station¡¦s Total Alkalinity at the same tide of the same day of measurement, whichever is higher |
≥ 118 or 130% of control station¡¦s Total Alkalinity at the same tide of the same day of measurement, whichever is higher |
Notes:
i. "Depth-averaged" is calculated by taking the arithmetic means of reading of all three depths.
ii. For DO, non-compliance of the water quality limits occurs when monitoring result is lower than the limits.
iii. For turbidity, SS and Salinity, non-compliance of the water quality limits occurs when monitoring result is higher than the limits.
2.4 Monitoring Results and Observations 2.4.1 DCM injection works and sand blanket laying works were conducted during the reporting period, thus both general water quality monitoring at the eleven monitoring stations and general DCM monitoring including monitoring stations S1, S2 and S3 were conducted. Monitoring results of 7 key parameters: Salinity, DO, turbidity, SS, pH, temperature and total alkalinity in each month of this reporting period, are summarized in Table 2.3, and results trending are presented graphically in Appendix C.Table 2.3 Summary of Impact Water Quality Monitoring Results
|
Locations |
Parameters |
||||||||||||||||||||||||
|
Salinity (ppt) |
Dissolved Oxygen (mg/L) |
pH |
Turbidity (NTU) |
Suspended Solids (mg/L) |
Temp. (oC) |
Total Alkalinity (mg/L) |
|||||||||||||||||||
|
Surface & Middle |
Bottom |
||||||||||||||||||||||||
|
Oct |
Nov |
Dec |
Oct |
Nov |
Dec |
Oct |
Nov |
Dec |
Oct |
Nov |
Dec |
Oct |
Nov |
Dec |
Oct |
Nov |
Dec |
Oct |
Nov |
Dec |
Oct |
Nov |
Dec |
||
|
B1 |
Avg. |
30.53 |
30.00 |
30.12 |
6.85 |
8.07 |
8.69 |
6.84 |
8.05 |
8.69 |
8.10 |
8.10 |
8.08 |
3.5 |
3.6 |
4.1 |
8.4 |
9.7 |
9.2 |
26.4 |
22.8 |
21.5 |
107.5 |
- |
113.4 |
|
Min. |
30.01 |
29.04 |
29.11 |
5.63 |
7.44 |
7.70 |
5.65 |
7.58 |
7.70 |
8.00 |
7.29 |
8.00 |
0.1 |
1.3 |
1.1 |
2.0 |
3.0 |
3.0 |
25.0 |
21.5 |
17.1 |
105.0 |
- |
111.0 |
|
|
Max. |
31.53 |
31.19 |
30.99 |
8.04 |
8.86 |
9.39 |
7.99 |
8.59 |
9.47 |
8.23 |
8.40 |
8.20 |
6.5 |
6.5 |
8.6 |
22.0 |
24.0 |
24.0 |
28.0 |
24.4 |
24.9 |
110.0 |
- |
116.0 |
|
|
B2 |
Avg. |
30.55 |
30.00 |
30.10 |
6.80 |
8.01 |
8.76 |
6.79 |
7.99 |
8.76 |
8.10 |
8.08 |
8.10 |
3.5 |
3.6 |
4.1 |
8.3 |
11.6 |
9.5 |
26.4 |
22.8 |
21.5 |
107.3 |
- |
113.3 |
|
Min. |
30.06 |
29.04 |
29.00 |
5.70 |
7.41 |
7.81 |
5.65 |
7.55 |
7.86 |
8.00 |
7.15 |
8.00 |
0.1 |
0.9 |
1.1 |
2.0 |
5.0 |
2.0 |
25.0 |
21.5 |
17.1 |
105.0 |
- |
111.0 |
|
|
Max. |
31.53 |
31.20 |
31.00 |
7.64 |
8.60 |
9.81 |
7.61 |
8.54 |
9.76 |
8.25 |
8.36 |
8.20 |
7.0 |
6.8 |
8.8 |
18.0 |
49.0 |
23.0 |
28.1 |
24.4 |
24.9 |
109.0 |
- |
115.0 |
|
|
B3 |
Avg. |
30.54 |
30.01 |
30.01 |
6.86 |
8.00 |
8.70 |
6.87 |
7.96 |
8.69 |
8.10 |
8.08 |
8.08 |
3.6 |
3.7 |
4.1 |
8.1 |
10.5 |
8.3 |
26.4 |
22.8 |
21.5 |
107.4 |
- |
113.3 |
|
Min. |
30.00 |
29.02 |
28.62 |
5.53 |
7.54 |
7.72 |
5.51 |
7.59 |
7.72 |
8.00 |
7.25 |
8.00 |
0.2 |
1.0 |
1.0 |
2.0 |
4.0 |
2.0 |
25.1 |
21.5 |
17.1 |
105.0 |
- |
111.0 |
|
|
Max. |
31.55 |
31.20 |
30.94 |
7.80 |
8.60 |
9.55 |
7.81 |
8.41 |
9.48 |
8.22 |
8.40 |
8.20 |
6.6 |
6.9 |
7.8 |
17.0 |
23.0 |
16.0 |
28.0 |
24.4 |
24.9 |
110.0 |
- |
115.0 |
|
|
B4 |
Avg. |
30.55 |
29.98 |
30.11 |
6.89 |
7.94 |
8.75 |
6.88 |
7.96 |
8.75 |
8.09 |
8.08 |
8.09 |
3.4 |
3.6 |
4.1 |
7.5 |
10.6 |
8.3 |
26.4 |
22.8 |
21.5 |
107.0 |
- |
113.3 |
|
Min. |
30.02 |
29.01 |
28.91 |
5.56 |
7.23 |
7.73 |
5.58 |
7.48 |
7.68 |
8.00 |
7.06 |
8.00 |
0.8 |
1.0 |
1.0 |
2.0 |
4.0 |
2.0 |
25.0 |
21.5 |
17.1 |
105.0 |
- |
111.0 |
|
|
Max. |
31.53 |
31.18 |
31.88 |
7.99 |
8.32 |
9.41 |
8.01 |
8.29 |
9.45 |
8.22 |
8.40 |
8.20 |
5.9 |
6.6 |
7.9 |
16.0 |
22.0 |
17.0 |
28.1 |
24.4 |
24.9 |
110.0 |
- |
115.0 |
|
|
C1 |
Avg. |
30.53 |
30.03 |
29.97 |
6.90 |
8.03 |
8.71 |
6.91 |
8.02 |
8.70 |
8.10 |
8.10 |
8.09 |
3.6 |
3.6 |
4.1 |
7.2 |
10.1 |
8.5 |
26.3 |
22.9 |
21.5 |
107.4 |
- |
113.1 |
|
Min. |
30.00 |
29.00 |
27.53 |
5.59 |
7.40 |
7.77 |
5.65 |
7.52 |
7.74 |
8.00 |
7.28 |
8.00 |
0.4 |
1.0 |
1.1 |
2.0 |
4.0 |
2.0 |
25.0 |
21.5 |
17.1 |
105.0 |
- |
110.0 |
|
|
Max. |
31.55 |
31.20 |
30.96 |
7.99 |
8.67 |
9.60 |
8.00 |
8.38 |
9.49 |
8.22 |
8.40 |
8.20 |
6.3 |
6.3 |
8.4 |
17.0 |
23.0 |
22.0 |
28.0 |
24.4 |
24.9 |
110.0 |
- |
116.0 |
|
|
C2 |
Avg. |
30.55 |
29.98 |
30.13 |
6.90 |
8.03 |
8.65 |
6.90 |
8.03 |
8.66 |
8.10 |
8.07 |
8.10 |
3.5 |
3.7 |
4.2 |
7.4 |
11.4 |
7.7 |
26.3 |
22.9 |
21.5 |
107.4 |
- |
113.3 |
|
Min. |
30.01 |
29.01 |
28.91 |
5.51 |
7.47 |
7.88 |
5.52 |
7.51 |
7.92 |
8.00 |
7.23 |
8.00 |
0.3 |
0.9 |
1.1 |
2.0 |
4.0 |
2.0 |
25.0 |
21.5 |
17.1 |
105.0 |
- |
111.0 |
|
|
Max. |
31.55 |
31.20 |
31.50 |
7.82 |
8.44 |
9.32 |
7.85 |
8.49 |
9.46 |
8.24 |
8.36 |
8.20 |
6.5 |
7.0 |
8.6 |
34.0 |
24.0 |
15.0 |
28.0 |
24.4 |
24.9 |
110.0 |
- |
115.0 |
|
|
CR1 |
Avg. |
30.55 |
30.03 |
30.11 |
6.93 |
8.01 |
8.75 |
6.93 |
8.00 |
8.74 |
8.10 |
8.08 |
8.09 |
3.6 |
3.7 |
4.1 |
7.3 |
10.8 |
10.2 |
26.3 |
22.9 |
21.5 |
107.9 |
- |
113.3 |
|
Min. |
30.01 |
29.03 |
28.95 |
5.59 |
7.33 |
7.94 |
5.60 |
7.36 |
8.03 |
8.01 |
7.22 |
8.00 |
0.6 |
1.1 |
1.1 |
2.0 |
4.0 |
2.0 |
25.0 |
21.5 |
17.1 |
105.0 |
- |
110.0 |
|
|
Max. |
31.55 |
31.20 |
30.94 |
7.85 |
8.72 |
9.65 |
7.88 |
8.51 |
9.50 |
8.24 |
8.40 |
8.20 |
6.6 |
6.0 |
8.4 |
14.0 |
26.0 |
24.0 |
28.0 |
24.4 |
24.9 |
111.0 |
- |
115.0 |
|
|
CR2 |
Avg. |
30.55 |
30.00 |
30.10 |
6.86 |
7.96 |
8.67 |
6.86 |
7.97 |
8.69 |
8.11 |
8.09 |
8.09 |
3.5 |
3.7 |
4.1 |
8.7 |
12.5 |
10.1 |
26.3 |
22.9 |
21.5 |
107.8 |
- |
113.4 |
|
Min. |
30.03 |
29.00 |
28.91 |
5.47 |
7.44 |
7.64 |
5.47 |
7.57 |
7.61 |
8.00 |
7.25 |
8.00 |
0.4 |
1.0 |
1.0 |
3.0 |
5.0 |
2.0 |
25.0 |
21.5 |
17.1 |
106.0 |
- |
111.0 |
|
|
Max. |
31.55 |
31.20 |
30.98 |
7.93 |
8.53 |
9.41 |
7.96 |
8.49 |
9.39 |
8.24 |
8.40 |
8.20 |
5.9 |
6.6 |
8.6 |
31.0 |
56.0 |
25.0 |
28.0 |
24.4 |
24.9 |
112.0 |
- |
115.0 |
|
|
F1 |
Avg. |
30.53 |
30.00 |
30.09 |
6.78 |
8.01 |
8.75 |
6.80 |
8.00 |
8.75 |
8.10 |
8.07 |
8.09 |
3.4 |
3.7 |
4.1 |
7.4 |
10.8 |
8.1 |
26.4 |
22.8 |
21.5 |
107.6 |
- |
113.2 |
|
Min. |
30.02 |
29.00 |
28.98 |
5.42 |
7.38 |
7.88 |
5.48 |
7.52 |
7.85 |
8.00 |
7.14 |
8.00 |
0.9 |
1.0 |
1.1 |
2.0 |
4.0 |
2.0 |
25.0 |
21.5 |
17.1 |
105.0 |
- |
111.0 |
|
|
Max. |
31.54 |
31.20 |
31.05 |
7.90 |
8.70 |
9.66 |
7.86 |
8.53 |
9.56 |
8.24 |
8.39 |
8.20 |
6.8 |
6.9 |
8.1 |
15.0 |
21.0 |
18.0 |
28.0 |
24.4 |
24.9 |
110.0 |
- |
115.0 |
|
|
H1 |
Avg. |
30.54 |
30.00 |
30.06 |
6.84 |
8.10 |
8.78 |
6.84 |
8.02 |
8.79 |
8.11 |
8.08 |
8.09 |
3.4 |
3.7 |
4.1 |
7.5 |
10.6 |
8.3 |
26.3 |
22.9 |
21.5 |
107.5 |
- |
113.4 |
|
Min. |
30.00 |
29.02 |
27.49 |
5.57 |
7.48 |
7.68 |
5.62 |
7.38 |
7.70 |
8.00 |
7.19 |
8.00 |
0.3 |
1.0 |
1.0 |
2.0 |
4.0 |
2.0 |
25.0 |
21.5 |
17.1 |
105.0 |
- |
111.0 |
|
|
Max. |
31.54 |
31.19 |
31.49 |
7.89 |
8.73 |
9.62 |
7.86 |
8.54 |
9.63 |
8.24 |
8.38 |
8.20 |
6.3 |
7.0 |
7.9 |
16.0 |
23.0 |
19.0 |
28.1 |
24.4 |
24.9 |
110.0 |
- |
116.0 |
|
|
M1 |
Avg. |
30.53 |
30.02 |
30.13 |
6.82 |
8.03 |
8.83 |
6.81 |
8.02 |
8.83 |
8.10 |
8.06 |
8.09 |
3.5 |
3.5 |
4.1 |
8.1 |
11.1 |
9.1 |
26.4 |
22.8 |
21.5 |
107.1 |
- |
113.4 |
|
Min. |
30.01 |
29.01 |
28.91 |
5.60 |
7.28 |
7.88 |
5.62 |
7.35 |
7.91 |
8.00 |
7.09 |
8.00 |
0.3 |
1.1 |
1.2 |
2.0 |
5.0 |
2.0 |
25.0 |
21.5 |
17.1 |
105.0 |
- |
111.0 |
|
|
Max. |
31.55 |
31.19 |
31.18 |
7.79 |
8.47 |
9.67 |
7.76 |
8.42 |
9.60 |
8.24 |
8.39 |
8.20 |
6.7 |
6.7 |
7.6 |
25.0 |
26.0 |
18.0 |
28.0 |
24.4 |
24.9 |
109.0 |
- |
117.0 |
|
|
S1 |
Avg. |
30.19 |
- |
30.11 |
6.60 |
- |
8.91 |
6.61 |
- |
8.90 |
8.11 |
- |
8.10 |
3.5 |
- |
4.3 |
11.2 |
- |
10.8 |
27.3 |
- |
20.9 |
107.6 |
- |
113.1 |
|
Min. |
30.04 |
- |
28.60 |
6.18 |
- |
7.72 |
6.18 |
- |
7.76 |
8.00 |
- |
8.00 |
1.4 |
- |
1.3 |
6.0 |
- |
2.0 |
26.5 |
- |
17.1 |
106.0 |
- |
111.0 |
|
|
Max. |
30.33 |
- |
31.17 |
7.37 |
- |
9.63 |
7.35 |
- |
9.65 |
8.24 |
- |
8.20 |
6.3 |
- |
8.8 |
15.0 |
- |
24.0 |
28.0 |
- |
24.9 |
110.0 |
- |
116.0 |
|
|
S2 |
Avg. |
30.16 |
- |
30.06 |
6.50 |
- |
8.89 |
6.50 |
- |
8.89 |
8.10 |
- |
8.09 |
3.6 |
- |
4.4 |
9.7 |
- |
10.6 |
27.3 |
- |
20.9 |
107.6 |
- |
113.2 |
|
Min. |
30.04 |
- |
28.24 |
6.06 |
- |
7.85 |
6.06 |
- |
7.92 |
8.00 |
- |
8.00 |
1.4 |
- |
1.2 |
5.0 |
- |
2.0 |
26.5 |
- |
17.1 |
106.0 |
- |
111.0 |
|
|
Max. |
30.31 |
- |
31.00 |
7.14 |
- |
9.65 |
7.16 |
- |
9.67 |
8.23 |
- |
8.20 |
6.8 |
- |
8.3 |
15.0 |
- |
24.0 |
28.2 |
- |
24.9 |
112.0 |
- |
116.0 |
|
|
S3 |
Avg. |
30.19 |
- |
30.15 |
6.58 |
- |
8.87 |
6.60 |
- |
8.86 |
8.12 |
- |
8.11 |
3.6 |
- |
4.3 |
10.1 |
- |
10.7 |
27.3 |
- |
20.9 |
108.0 |
- |
113.4 |
|
Min. |
30.03 |
- |
29.43 |
6.30 |
- |
7.79 |
6.31 |
- |
7.86 |
8.00 |
- |
8.00 |
1.3 |
- |
1.2 |
6.0 |
- |
2.0 |
26.5 |
- |
17.1 |
106.0 |
- |
111.0 |
|
|
Max. |
30.39 |
- |
31.61 |
7.24 |
- |
9.45 |
7.23 |
- |
9.44 |
8.23 |
- |
8.20 |
6.8 |
- |
8.0 |
13.0 |
- |
26.0 |
28.0 |
- |
24.9 |
112.0 |
- |
117.0 |
|
Notes:
i. "Avg", ¡§Min¡¨ and ¡§Max¡¨ is the average, minimum and maximum respectively of the data from measurements conducted under mid-flood and mid-ebb tides at three water depths, except that of DO where the data for ¡§Surface & Middle¡¨ and ¡§Bottom¡¨ are calculated separately.
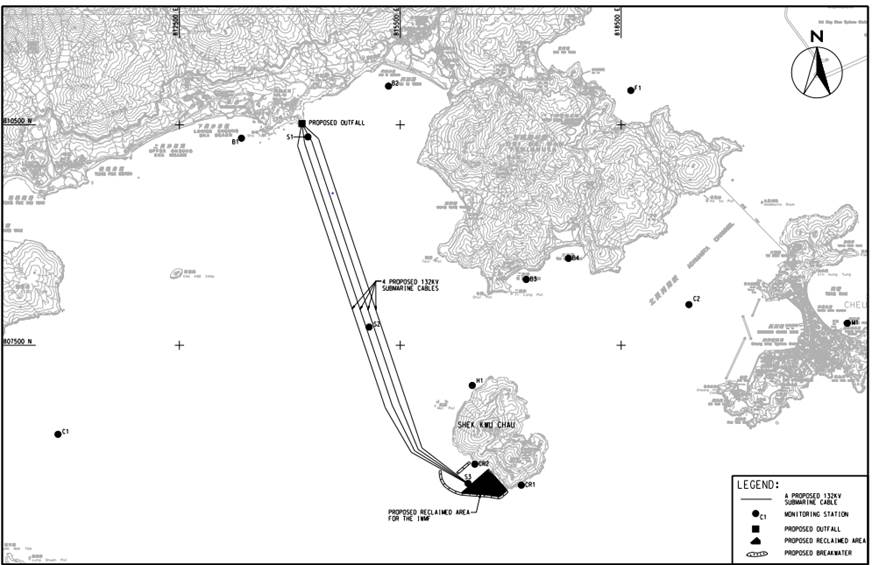
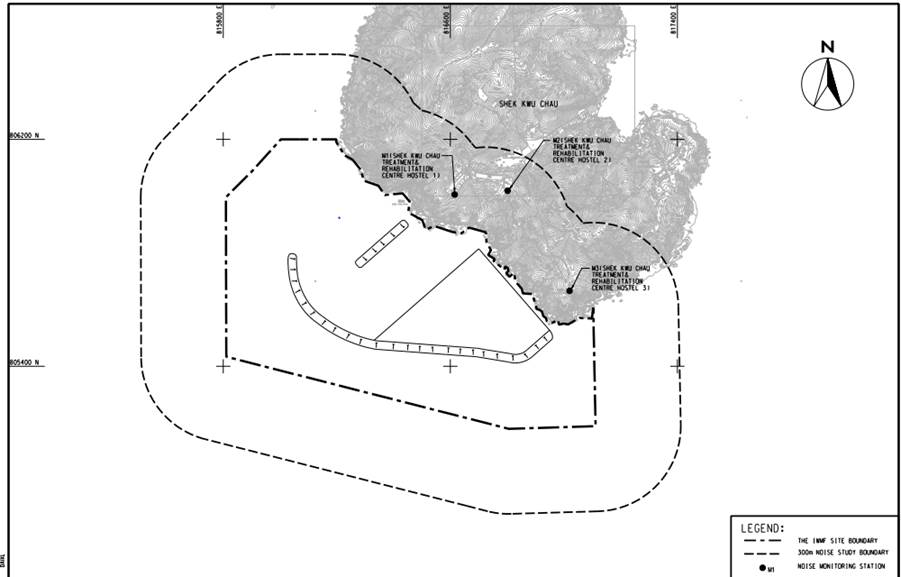
3. Noise Monitoring 3.1 Noise Monitoring Parameters 3.1.1 Impact noise monitoring was conducted weekly in the reporting period between 0700-1900 on normal weekdays. 3.1.2 Construction noise level measured in terms of the A-weighted equivalent continuous sound pressure level (LAeq). Leq 30min was used as the monitoring parameter for the time period between 0700 and 1900 hours on normal weekdays. Table 3.1 summarizes the monitoring parameters, frequency and duration of the impact noise monitoring.
Table 3.1 Noise Monitoring Parameters, Time, Frequency and Duration
|
Monitoring Station |
Time |
Duration |
Parameters |
|
M1/ N_S1, M2/ N_S2, M3/ N_S3 |
Daytime: 0700-1900 hrs (during normal weekdays, not include Sunday or general holiday) |
Once per week Leq 5min/Leq 30min (average of 6 consecutive Leq 5min) |
Leq, L10 & L90 |
|
|
Figure 3.1 Noise monitoring locations at SKC |
Table 3.2 Noise Monitoring Location
|
Station |
NSR ID in EIA Report |
Noise Monitoring Location |
Type of sensitive receiver(s) |
Measurement Type |
|
M1 |
N_S1 |
Shek Kwu Chau Treatment & Rehabilitation Centre Hostel 1 |
Residential |
Façade |
|
M2 |
N_S2 |
Shek Kwu Chau Treatment & Rehabilitation Centre Hostel 2 |
Residential |
Façade |
|
M3 |
N_S3 |
Shek Kwu Chau Treatment & Rehabilitation Centre Hostel 3 |
Residential |
Façade |
Table 3.3 Action and Limit Levels for Noise
|
Time Period |
Action |
Limit (dB(A)) |
|
0700-1900 hrs on normal weekdays |
When one documented complaint is received |
75 dB(A) |
Table 3.4 Summary of Field Observation
|
Monitoring Station |
Major Noise Source |
|
M1 |
Installation of air-conditioning units nearby |
|
M2 |
Installation of air-conditioning units nearby |
|
M3 |
Air-conditioning units nearby |
Table 3.5 Summary of Impact Noise Monitoring Results
|
Location |
Noise in dB(A) |
||||||||
|
Range of Leq 30min |
Range of L10 5min |
Range of L90 5min |
|||||||
|
Oct |
Nov |
Dec |
Oct |
Nov |
Dec |
Oct |
Nov |
Dec |
|
|
M1 |
49.4 ¡V 58.1 |
48.8 ¡V 60.8 |
50.2 ¡V 52.4 |
50.4 ¡V 63.0 |
48.1 ¡V 63.0 |
50.2 ¡V 55.9 |
43.9 ¡V 55.9 |
45.2 ¡V 60.3 |
45.2 ¡V 48.1 |
|
M2 |
50.0 ¡V 56.6 |
51.9 ¡V 60.6 |
53.9 ¡V 55.8 |
51.1 ¡V 65.2 |
51.5 ¡V 66.5 |
55.2 ¡V 61.2 |
42.6 ¡V 54.4 |
44.6 ¡V 55.3 |
48.1 ¡V 54.2 |
|
M3 |
45.9 ¡V 54.5 |
51.1 ¡V 54.7 |
49.7 ¡V 52.9 |
41.8 ¡V 59.9 |
52.4 ¡V 58.4 |
52.0 ¡V 55.0 |
41.9 ¡V 50.8 |
46.5 ¡V 53.7 |
45.2 ¡V 48.5 |
4. Waste 4.1 The waste generated from this Project includes inert construction and demolition (C&D) materials, and non-inert C&D materials. Non-inert C&D materials are made up of general refuse, vegetative wastes and recyclable wastes such as plastics and paper/cardboard packaging waste. Steel materials generated from the project are also grouped into non-inert C&D materials as the materials were not disposed of with other inert C&D materials. 4.2 As advised by the Contractor, for C&D waste, no metals were generated and collected by registered recycling collector. No paper cardboard packing were generated on site and collected by registered recycling collector. No plastic waste was collected by registered recycling collector. 870L and 200kg of chemical waste were collected by licensed chemical waste collector. 4.2 tonnes of other types of wastes (e.g. general refuse) were generated on site and disposed of at Landfill. 4.3 With reference to relevant handling records and trip tickets of this Project, the quantities of different types of waste generated in the reporting month are summarised in Table 4.1. Details of cumulative waste management data are presented as a waste flow table in Appendix E.
Table 4.1 Quantities of Waste Generated from the Project
|
Reporting period |
Quantity |
||||||
|
Inert C&D Materials (in¡¥000kg) |
Chemical Waste (in¡¥000L) |
Chemical Waste (in¡¥000kg) |
Non-inert C&D Materials |
||||
|
Others, e.g. General Refuse disposed at Landfill (in¡¥000kg) |
Recycled materials |
||||||
|
Paper/card board (in¡¥000kg) |
Plastics (in¡¥000kg) |
Metals (in¡¥000kg) |
|||||
|
October 2018 |
0 |
0 |
0 |
4.2 |
0 |
0 |
0 |
|
November 2018 |
0 |
0 |
0 |
0 |
0 |
0 |
0 |
|
December 2018 |
0 |
0.87 |
0.2 |
0 |
0 |
0 |
0 |
Hard coral: Percentage of surface area exhibiting partial mortality and blanched/bleached area of each coral colony and degree of sedimentation.
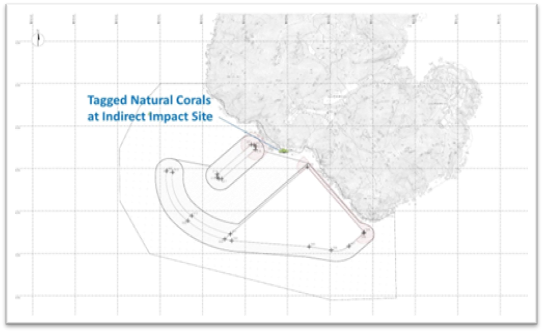
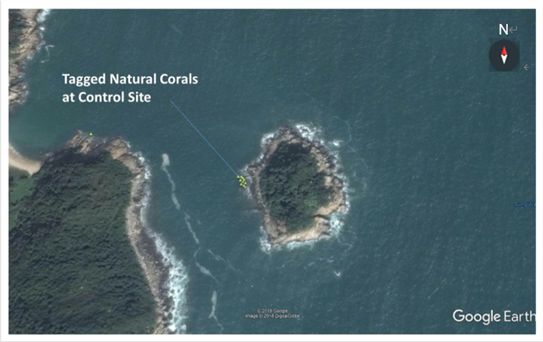
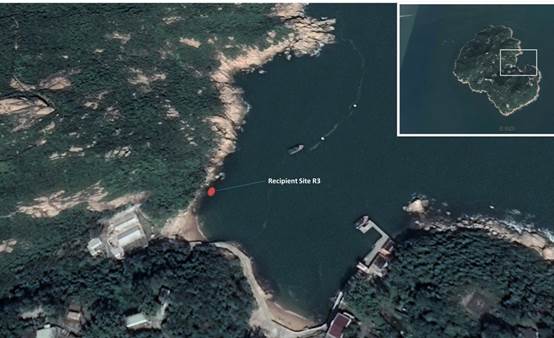
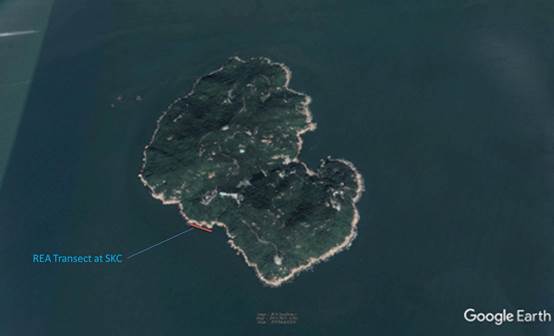
5.2 Coral Monitoring Locations Location of the ten tagged coral colonies at each of the proposed indirect impact site, control site, the recipient site R3 and REA transect at proposed indirect impact site are shown in Figure 5.1, Figure 5.2, Figure 5.3 and Figure 5.4 respectively:|
|
|
Figure 5.1 Tagged Natural Corals at Indirect Impact Site Near SKC for re-tagging after typhoon Mangkhut |
|
|
|
Figure 5.2 Tagged Natural Corals at Control Site Near Yuen Kong Chau for re-tagging after typhoon Mangkhut |
|
|
|
Figure 5.3 Tagged Translocation Corals at Recipient Site R3 near SKC |
|
|
|
Figure 5.4 REA Transect at Indirect Impact Site near SKC |
Table 5.1 Tagged Natural Corals during Baseline and Re-tagged Natural Corals after Typhoon Manghkut at Control Site near Yuen Long Chau
|
Coral # note i |
GPS Coordinates |
|
|
1 |
N22¢X09¡¦45.96¡¨ |
E113¢X54¡¦57.81¡¨ |
|
2R |
N22¢X11¡¦29.12¡¨ |
E113¢X59¡¦09.01¡¨ |
|
3 |
N22¢X09¡¦45.81¡¨ |
E113¢X54¡¦57.78¡¨ |
|
4 |
N22¢X09¡¦45.70¡¨ |
E113¢X54¡¦57.95¡¨ |
|
5R |
N22¢X11¡¦29.10¡¨ |
E113¢X59¡¦09.18¡¨ |
|
6 |
N22¢X09¡¦45.75¡¨ |
E113¢X54¡¦58.02¡¨ |
|
7R |
N22¢X11¡¦29.17¡¨ |
E113¢X59¡¦08.86¡¨ |
|
7 |
N22¢X09¡¦45.65¡¨ |
E113¢X54¡¦57.94¡¨ |
|
8 |
N22¢X09¡¦45.53¡¨ |
E113¢X54¡¦57.90¡¨ |
|
9 |
N22¢X09¡¦46.23¡¨ |
E113¢X54¡¦54.70¡¨ |
|
10R |
N22¢X11¡¦29.18¡¨ |
E113¢X59¡¦08.91¡¨ |
Notes:
i. The re-tagged corals were marked as ##R.
Table 5.2 Re-tagged Natural Corals after Typhoon Manghkut at Indirect Impact Site near SKC
|
Coral # note i |
GPS Coordinates |
|
|
11R |
N22¢X11¡¦29.14¡¨ |
E113¢X59¡¦08.92¡¨ |
|
12R |
N22¢X11¡¦29.12¡¨ |
E113¢X59¡¦09.01¡¨ |
|
13R |
N22¢X11¡¦29.11¡¨ |
E113¢X59¡¦09.07¡¨ |
|
14R |
N22¢X11¡¦29.13¡¨ |
E113¢X59¡¦09.12¡¨ |
|
15R |
N22¢X11¡¦29.10¡¨ |
E113¢X59¡¦09.18¡¨ |
|
16R |
N22¢X11¡¦29.07¡¨ |
E113¢X59¡¦09.23¡¨ |
|
17R |
N22¢X11¡¦29.17¡¨ |
E113¢X59¡¦08.86¡¨ |
|
18R |
N22¢X11¡¦29.14¡¨ |
E113¢X59¡¦08.94¡¨ |
|
19R |
N22¢X11¡¦29.20¡¨ |
E113¢X59¡¦08.81¡¨ |
|
20R |
N22¢X11¡¦29.18¡¨ |
E113¢X59¡¦08.91¡¨ |
Notes:
i. The re-tagged corals were marked as ##R.
Table 5.3 GPS Coordinates of Recipient Site R3
|
Site |
GPS Coordinates |
|
|
R3 |
N22¢X11¡¦43.69¡¨ |
E113¢X28.99¡¨ |
5.3 Action and Limit Levels 5.3.1 Monitoring result was reviewed and compared against the below Action Level and Limit Level (AL/LL) as set with the below Table 5.4 and Table 5.5.
Table 5.4 Action and Limit Levels for Construction Phase Coral Monitoring
|
Parameter |
Action Level |
Limit Level |
|
Mortality |
If during Impact Monitoring a 15% increase in the percentage of partial mortality on the corals occurs at more than 20% of the tagged indirect impact site coral colonies that is not recorded on the tagged corals at the control site, then the Action Level is exceeded. |
If during Impact Monitoring a 25% increase in the percentage of partial mortality on the corals occurs at more than 20% of the tagged indirect impact site coral colonies that is not recorded on the tagged corals at the control site, then the Limit Level is exceeded. |
Table 5.5 Action and Limit Levels for Post-Translocation Coral Monitoring
|
Parameter |
Action Level |
Limit Level |
|
Mortality |
If during Post-Translocation Monitoring a 15% increase in the percentage of partial mortality on the corals occurs at more than 20% of the translocated coral colonies that is not recorded on the original corals in the recipient site, then the Action Level is exceeded. |
If during Post-Translocation Monitoring a 25% increase in the percentage of partial mortality on the corals occurs at more than 20% of the translocated coral colonies that is not recorded on the original corals in the recipient site, then the Limit Level is exceeded. |
Table 5.6 Weather Condition for the Re-tagging Coral Colonies at both Indirect Impact Site and Control Site
|
Date |
Location |
Condition |
Average Underwater Visibility |
|
23 November 2018 |
Indirect Impact Site |
- Southwest force 4 to 5 - Sunny period |
Less than 0.5 m |
|
3 December 2018 |
Control Site |
- North force 2 to 3 - Sunny Period |
Less than 0.5 m |
Table 5.7 Weather Condition for the Third Coral Translocation Monitoring
|
Date |
Condition |
Average Underwater Visibility |
|
3 December 2018 |
- North force 2 to 3 - Sunny Period |
Less than 0.5 m |
Table 5.8 GPS coordinates of REA Transect Starting and Ending points, maximum depth and bottom substrate at Indirect Impact Site
|
Site |
GPS Location at Starting Point |
GPS Location at Ending Point |
Max. Depth |
Bottom Substrate |
|
Indirect Impact Site |
E 113¢X59¡¦08.19¡¨ |
E 113¢X59¡¦11,511¡¨ |
3.5 m |
Natural Bedrock and Boulders |
|
N 22¢X11¡¦29.09¡¨ |
N 22¢X11¡¦28.45¡¨ |
Table 5.9 Sizes, Condition, Mortality, Bleaching and Sediment of 4 Re-tagged Natural Coral Colonies at Control Site during 4th to 6th Months Construction Phase Monitoring
|
Coral # ¡@ |
Species ¡@ |
Size (cm) ¡V Max. Diameter ¡@ |
Condition ¡@ |
Mortality (%) |
Bleaching (%) |
Sediment (%) |
|
03/12 |
03/12 |
03/12 |
||||
|
2R |
Goniopora stutchburyi |
10 |
Good |
0 |
0 |
0 |
|
5R |
Goniopora stutchburyi |
18 |
Good |
0 |
0 |
0 |
|
7R |
Coscinaraea sp. |
15 |
Good |
0 |
0 |
0 |
|
10R |
Goniopora stutchburyi |
20 |
Good |
0 |
0 |
0 |
Notes:
i. The re-tagged corals were marked as ##R
Table 5.10 Sizes, Condition, Mortality, Bleaching and Sediment of 10 Re-tagged Natural Coral Colonies at Indirect Impact Site during 4th to 6th Months Construction Phase Monitoring
|
Coral # ¡@ |
Species ¡@ |
Size (cm) ¡V Max. Diameter ¡@ |
Condition ¡@ |
Mortality (%) |
Bleaching (%) |
Sediment (%) |
|
23/11 |
23/11 |
23/11 |
||||
|
11R |
Cyphastrea serailia |
48 |
Fair |
0 |
0 |
0 |
|
12R |
Favites chinensis |
27 |
Good |
0 |
0 |
0 |
|
13R |
Turbinaria peltata |
21 |
Fair |
0 |
0 |
0 |
|
14R |
Favites chinensis |
8 |
Good |
0 |
0 |
0 |
|
15R |
Goniopora stutchburyi |
11 |
Good |
0 |
0 |
0 |
|
16R |
Psammocora superficialis |
27 |
Fair |
0 |
0 |
0 |
|
17R |
Favites chinensis |
15 |
Good |
0 |
0 |
0 |
|
18R |
Psammocora superficialis |
39 |
Good |
0 |
0 |
0 |
|
19R |
Psammocora superficialis |
42 |
Fair |
0 |
0 |
0 |
|
20R |
Psammocora superficialis |
29 |
Good |
0 |
0 |
0 |
Notes:
i. The re-tagged corals were marked as ##R
Table 5.11 Sizes, Condition, Mortality, Bleaching and Sediment of 16 Translocated Coral Colonies at Recipient Site for 3rd Post Translocation Coral Monitoring
|
Coral # |
Species |
Size (cm) ¡V Max. Diameter/ Height |
Mortality (%) |
Bleaching (%) |
Sediment (%) |
|||
|
Baseline |
03/12 |
Baseline |
03/12 |
Baseline |
03/12 |
|||
|
1 |
Psammocora superficialis |
35 |
0 |
15 |
0 |
0 |
0 |
0 |
|
2 |
Psammocora superficialis |
N/A |
35 |
N/A |
0 |
N/A |
0 |
N/A |
|
3 |
Psammocora superficialis |
N/A |
0 |
N/A |
0 |
N/A |
0 |
N/A |
|
4 |
Turbinaria peltata |
9 |
0 |
10 |
0 |
0 |
0 |
0 |
|
5 |
Goniopora stutchburyi |
N/A |
0 |
N/A |
0 |
N/A |
0 |
N/A |
|
6 |
Psammocora superficialis |
26 |
0 |
15 |
0 |
0 |
0 |
0 |
|
7 |
Psammocora superficialis |
23 |
0 |
5 |
0 |
0 |
5 |
0 |
|
8 |
Psammocora superficialis |
N/A |
0 |
N/A |
0 |
N/A |
0 |
N/A |
|
9 |
Goniopora stutchburyi |
N/A |
0 |
N/A |
0 |
N/A |
0 |
N/A |
|
10 |
Coscinaraea n sp. |
21 |
0 |
5 |
0 |
0 |
1 |
0 |
|
11 |
Psammocora superficialis |
13 |
0 |
0 |
0 |
0 |
0 |
0 |
|
12 |
Psammocora superficialis |
N/A |
0 |
N/A |
0 |
N/A |
0 |
N/A |
|
13 |
Psammocora superficialis |
N/A |
0 |
N/A |
0 |
N/A |
0 |
N/A |
|
14 |
Psammocora superficialis |
N/A |
0 |
N/A |
0 |
NA |
0 |
N/A |
|
15 |
Goniopora stutchburyi |
N/A |
0 |
N/A |
0 |
N/A |
0 |
N/A |
|
16 |
Psammocora superficialis |
26 |
0 |
10 |
0 |
N/A |
0 |
0 |
*N/A: Non Applicable as coral colonies were missing
Table 5.12 Sizes, Condition, Mortality, Bleaching and Sediment of 10 Natural Control Coral Colonies at Recipient Site for 3rd Post Translocation Coral Monitoring
|
Coral # |
Species |
Size (cm) ¡V Max. Diameter/ Height |
Mortality (%) |
Bleaching (%) |
Sediment (%) |
|||
|
Baseline |
03/12 |
Baseline |
03/12 |
Baseline |
03/12 |
|||
|
1 |
Coscinaraea n sp. |
16 |
0 |
0 |
0 |
0 |
0 |
0 |
|
2 |
Psammocora superficialis |
24 |
0 |
0 |
0 |
0 |
0 |
0 |
|
3 |
Psammocora superficialis |
23 |
0 |
0 |
0 |
0 |
0 |
0 |
|
4 |
Coscinaraea n sp. |
15 |
0 |
0 |
0 |
0 |
0 |
0 |
|
5 |
Cyphastrea serailia |
42 |
0 |
0 |
0 |
0 |
0 |
0 |
|
6 |
Cyphastrea serailia |
12 |
0 |
0 |
0 |
0 |
0 |
0 |
|
7 |
Cyphastrea serailia |
46 |
0 |
0 |
0 |
0 |
0 |
0 |
|
8 |
Psammocora superficialis |
21 |
0 |
0 |
0 |
0 |
0 |
0 |
|
9 |
Psammocora superficialis |
19 |
0 |
0 |
0 |
0 |
0 |
0 |
|
10 |
Goniopora stutchburyi |
N/A |
0 |
N/A |
0 |
N/A |
0 |
N/A |
*N/A: Non Applicable as coral colonies were missing.
Table 5.13 Ecological and Substratum Attributes of Indirect Impact Site
|
Ecological Attributes |
Rank |
|
Hard Corals |
0.5 |
|
Dead Coral |
0 |
|
Octocoral |
0 |
|
Sea anemone beds |
0 |
|
Dead Standing Corals |
0 |
|
Other Benthos |
1 |
|
Macroalgae |
0 |
|
Substratum Attributes |
Rank |
|
Bedrock |
5 |
|
Boulders (diameter >50cm) |
4 |
|
Cobbles (diameter <50cm) |
0 |
|
Rubble (dead corals) |
0 |
|
Sand with gravel |
0 |
|
Mud & Silt |
0 |
Table 5.14 Taxon Abundance of Indirect Impact Site
|
Benthic Communities |
Abundance in the Site |
|
Corals |
|
|
Goniopora stutchburyi |
1 |
|
Psammocora superficialis |
1 |
|
Favites chinensis |
1 |
|
Other Benthos |
|
|
Thais luteostoma |
1 |
|
Septifer virgatus |
1 |
|
Anthocidaris crassispina |
1 |
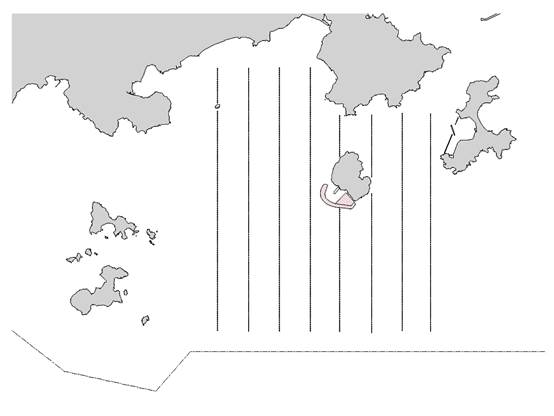
6. Marine Mammal 6.1 Survey Methods 6.1.1 Vessel-based Line-transect Survey
For the vessel-based marine mammal surveys, the monitoring team adopted the standard line-transect method (Buckland et al. 2001) as same as that adopted during the EIA study and pre-construction phase monitoring to allow fair comparison of marine mammal monitoring results.
Eight transect lines are set at Southeast Lantau survey area, including Shek Kwu Chau, waters between Shek Kwu Chau and the Soko Islands, inshore waters of Lantau Island (e.g. Pui O Wan) as well as southwest corner of Cheung Chau as shown in Figure 6.1 below:
|
|
Figure 6.1 Line Transects for Marine Mammal Surveys |
In comparison to the baseline monitoring results, results from the analyzed construction phase monitoring data would allow the detection of any changes of their usage of habitat, in response to the scheduled construction works.
6.2 Specific Mitigation Measures 6.2.1 Monitored exclusion zonesDuring the installation/re-installation/relocation process of floating type silt curtains, in order to avoid the accidental entrance and entrapment of marine mammals within the silt curtains, a monitored exclusion zone of 250 m radius from silt curtain should be implemented and monitored by competent Marine Mammal Observers (MMOs). (Marine Mammal Exclusion Zone (MMEZ) would also be implemented for precautionary purpose for DCM works.
6.2.2 Marine mammal watching planUpon the completion of silt curtain installation/re-installation/relocation, marine mammal watching plan would be implemented to observe the presence of any marine mammal around the localized silt curtain or being trapped by the localized silt curtain.
6.3 Results and Observations 6.3.1 Vessel-based Line-transect Survey 4 monthly surveys were conducted during the reporting period. As this is overlapping with the designated off-peak season (June - November) and peak season (December - May, only one survey was completed in off-peak season while two surveys were completed in peak season. A total on effort (transects only) survey length of 158.7km was completed, 128km at Beaufort Sea State 2 or better (Table 6.1). 6 sightings of marine mammals were recorded and the details of recorded sightings were summarized and shown in Table 6.2.Table 6.1 Summary of Vessel-based Line-transect Survey Effort
|
Date |
Area* |
Beaufort |
Effort (km) |
Season |
Vessel |
Effort Type** |
|
12-Oct-18 |
SEL |
1 |
11.6 |
AUTUMN |
SMRUHK |
P |
|
12-Oct-18 |
SEL |
2 |
21.6 |
AUTUMN |
SMRUHK |
P |
|
12-Oct-18 |
SEL |
3 |
4.9 |
AUTUMN |
SMRUHK |
P |
|
12-Oct-18 |
SEL |
4 |
1.6 |
AUTUMN |
SMRUHK |
P |
|
6-Nov-18 |
SEL |
1 |
4.9 |
AUTUMN |
SMRUHK |
P |
|
6-Nov-18 |
SEL |
2 |
11.3 |
AUTUMN |
SMRUHK |
P |
|
6-Nov-18 |
SEL |
3 |
14.1 |
AUTUMN |
SMRUHK |
P |
|
6-Nov-18 |
SEL |
4 |
9.2 |
AUTUMN |
SMRUHK |
P |
|
6-Dec-18 |
SEL |
1 |
8.9 |
WINTER |
SMRUHK |
P |
|
6-Dec-18 |
SEL |
2 |
29.9 |
WINTER |
SMRUHK |
P |
|
6-Dec-18 |
SEL |
3 |
0.9 |
WINTER |
SMRUHK |
P |
|
20-Dec-18 |
SEL |
0 |
0.8 |
WINTER |
SMRUHK |
P |
|
20-Dec-18 |
SEL |
1 |
29.4 |
WINTER |
SMRUHK |
P |
|
20-Dec-18 |
SEL |
2 |
9.6 |
WINTER |
SMRUHK |
P |
* As shown in Figure. 6.1
** P (from AFCD) denotes the ON EFFORT survey on the transect line, not the adjoining passages
Table 6.2 Summary of Sightings Recorded during October 2018 to December 2018 of Vessel-based Line-transect Survey Effort
|
Species |
Sighting No. |
Time |
Group Size |
PSD |
Behaviour |
Latitude |
Longitude |
Area |
Effort Type |
Season |
|
|
6-Nov-18 |
Finless Porpoise |
1 |
11:47 |
1 |
139 |
Unknown |
22.18955 |
113.9735 |
SEL |
Impact |
Autumn |
|
6-Dec-18 |
Finless Porpoise |
2 |
11:30 |
1 |
N/A |
Travel |
22.1645 |
113.9681 |
SEL |
Impact |
Winter |
|
6-Dec-18 |
Finless Porpoise |
3 |
12:37 |
2 |
3 |
Travel |
22.1804 |
113.993 |
SEL |
Impact |
Winter |
|
20-Dec-18 |
Finless Porpoise |
4 |
13:38 |
1 |
N/A |
Unknown |
22.2127 |
113.9557 |
SEL |
Impact |
Winter |
|
20-Dec-18 |
Finless Porpoise |
5 |
11:26 |
2 |
52 |
Travel |
22.2097 |
113.9541 |
SEL |
Impact |
Winter |
|
20-Dec-18 |
Finless Porpoise |
6 |
12:53 |
1 |
65 |
Travel |
22.1724 |
113.9853 |
SEL |
Impact |
Winter |
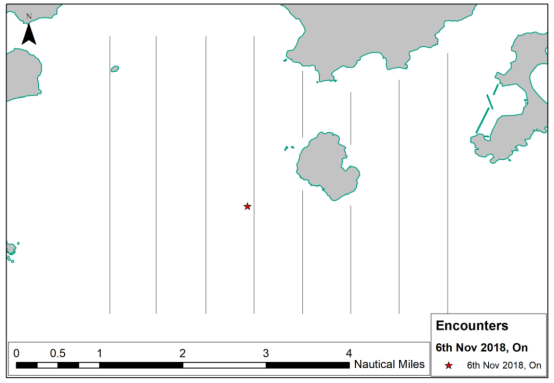
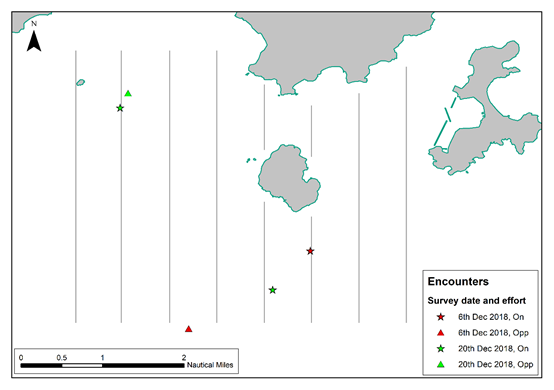
Figure 6.2 Location of sightings recorded during November and December 2018 Vessel-based Line-transect Survey
A review of the long term AFCD marine mammal monitoring programme, the EIA and the pre-construction baseline monitoring report for this project was conducted. Both the EIA and the pre-construction baseline monitoring were conducted during the peak porpoise months (Dec-May 2008 and Feb-April 2018, respectively), and, as such, these data are not directly comparable to this survey month which is a porpoise off-peak month. Therefore, a comparison can only be made to the AFCD long term marine mammal monitoring data. A review of the Beaufort Sea state survey conditions between 2009 and 2017 (only data available from AFCD at time of writing; (AFCD 2018; 2017; 2016; 2015; 2014; 2013; 2012; 2011; 2010) shows that survey conditions in October to December 2018 were within the % limits of previous AFCD surveys. A review of all the porpoise sightings in the survey area for October to December between 2009-2017 indicates that there are fluctuations between the number of sightings usually recorded in October to December. Given the similar survey conditions and the low encounter rate recorded for porpoise in the project area during the reporting period, an increase in sightings within this area in October to December 2018 is in agreement with the detailed in AFCD long term monitoring data. It is difficult to draw conclusions with regards to impacts on marine mammals as predicted in the EIA and the effectiveness of project mitigation measures during the initial phase of construction activities when porpoise sightings are typically absent or very low during the survey months. As surveys continue for this project, data shall be constantly re-evaluated across survey months to discern trends and impacts, if any. 6.3.2 Specific Mitigation Measures Silt curtains were deployed for sand blanket laying works and DCM trial during the reporting period. At least two MMO were on duty for continuous monitoring of the Marine Mammal Exclusion Zone (MMEZ) for DCM trial works and installation/re-installation/relocation process of silt curtains, and the marine mammal trapping checking and silt curtains inspection in accordance with the Detailed Monitoring Programme of Finless Porpoise and Marine Mammal Watching Plan respectively. Trainings for the MMO were provided by the ET prior to the aforementioned works, with a cumulative total of 63 individuals being trained and the training records kept by the ET. From the Marine Mammal observation records and MMEZ monitoring log records, sightings of Finless Porpoise were observed within the cluster MMEZ on 29 December 2018 during this reporting month. The sightings of finless porpoise were first seen at 08:25 and last seen 08:55 on 29 December 2018. After the first observation of finless porpoise by MMO, all construction activities were ceased until 09:25 which was 30 minutes later the last seen of finless porpoise. 6.3.3 Photo records of the marine mammal monitoring taken during the reporting period are presented in Appendix G.7. White-Bellied Sea Eagle 7.1 WBSE Monitoring Parameters 7.1.1 Information to be collected included feeding, perching/roosting, preening, soaring, flying, nesting and territorial guarding and the time spent on each activity. The responses and reactions to any disturbance to the WBSEs were also recorded and examined in conjunction with the construction noise and/or other events in the vicinity. Other disturbances such as weather condition, or invasion by other fauna species were also recorded. 7.2 Results and Observations 7.2.1 Four monitoring for monthly construction phase were conducted during the reporting period. Since there is no landing point along the western part of SKC, boat survey were used for the monitoring survey. In order to increase the chance of finding the WBSEs, monitoring survey was carried out either early in the morning or later in the afternoon. The weather conditions of monitoring survey were shown in Table 7.1.
Table 7.1 Weather Conditions during the WBSE Monitoring
|
Date |
Condition |
Temperature (¢J) |
|
30 October 2018 |
- Southeast wind as Beaufort force 3 - Sunny |
31.0 |
|
23 November 2018 |
- Southeast 4 to 5 - Sunny periods |
27.0 |
|
3 December 2018 |
- North force 2 to 3 - Sunny period |
25.0 |
|
18 December 2018 |
- Northeast force 4 to 5 - Sunny period |
18.0 |
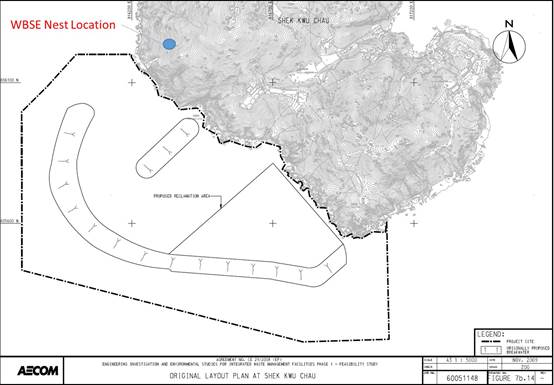
Figure 7.1 Location of WBSE Nest on SKC
7.2.4 No invasion of other fauna species was recorded and no sign of using the construction site as a foraging ground was recorded as well. 7.2.5 During the reporting period, no abnormal behaviour of the recorded adults was shown. All marine works during the fourth to sixth months construction period did not show any influence to the WBSE. 7.2.6 Photo records of the WBSE taken during the reporting period are presented in Appendix H.
9. EM&A Site Inspection 9.1 Site inspections were carried out on a weekly basis to monitor the implementation of proper environmental pollution control and mitigation measures under the Contract. Site inspections were carried out at the Site Portions 1, 1A & 1B and Portion 7 during the reporting period. Portions 1, 1A & 1B were the sites near SKC within the Site boundary and Portion 7 was the site at Tung Chung for stockpiling of construction materials. 9.2 Joint site inspection with IEC was carried out on a monthly basis. 9.3 Minor deficiencies were observed during weekly site inspection. Key observations during the site inspections are summarized below:
¡P Site tidiness were not maintained properly
¡P Prevention actions for oil/chemical spillage were not carried out properly
¡P Environmental permits/licenses were not displayed
¡P Silt curtains were not deployed properly
¡P Sand was accumulated on the pontoon¡¦s surface
9.4 The Contractor has rectified most of the observations identified during environmental site inspections in the reporting period. 9.5 During site inspection, installed silt curtain were found damaged for some idling works. The contractor was reminded to properly fix and maintain the deployed silt curtains prior to the operation of concerned construction works during the site walk by ET and IEC. The Contractor conducted the maintenance of deployed silt curtain immediately before resuming any construction works. 9.6 According to the EIA Study Report, Environmental Permit, contract documents and Updated EM&A Manual, the mitigation measures detailed in the documents, except the silt curtain system, are implemented as much as practical during the reporting period. An updated Implementation Status of Environmental Mitigation Measures (EMIS) is provided in Appendix B.10. Conclusion and Recommendations 10.1 This 2nd Quarterly Environmental Monitoring and Audit (EM&A) Report summarizes the EM&A works undertaken during the period from 1 October 2018 to 31 December 2018 in accordance with the Updated EM&A Manual and the requirement under EP- 429/2012/A and FEP-01/429/2012/A. 10.2 Construction noise, water quality, construction waste, coral, marine mammal and White-Bellied Sea Eagle (WBSE) monitoring were carried out in the reporting period. No project-related exceedance of the Action and Limit Level was recorded during the reporting period, however, environmental deficiencies of the Contractor on the implementation of silt curtain deployment system were spotted. 10.3 Weekly environmental site inspection was conducted during the reporting period. Environmental deficiencies were observed during site inspection and were rectified. 10.4 The Contractor has been reminded to facilitate the ET¡¦s investigation in the time frame stated at Event and Action plan under the updated EM&A Manual by promptly providing site records and information. 10.5 According to the environmental site inspections performed in the reporting period, the Contractor is reminded to pay attention on maintaining site tidiness and avoidance of oil spillage on-site and sand accumulation on the pontoon surface during sand blanket laying works. 10.6 Regarding to the deployment of silt curtains as a principal water quality impact mitigation measures on various marine works, the Contractor has been reminded to follow strictly to the design and checking procedure as specified in the Silt Curtain Deployment Plan. The Contractor is reminded that all measures recommended in the deposited silt curtain deployment plan shall be fully and properly implemented for the Project as per EP condition 2.6 of the FEP. 10.7 No environmental complaint was received in the reporting period. 10.8 No notification of summons or prosecution was received since commencement of the Contract. 10.9 The ET will keep track on the construction works to confirm compliance of environmental requirements and the proper implementation of all necessary mitigation measures.