6.
Marine Mammal
6
6.1
Survey
Methods
6.1.1
Vessel-based Line-transect Survey
6.1.1.1
For
the vessel-based marine mammal surveys, the monitoring team adopted the standard
line-transect method (Buckland et al. 2001) as same as that adopted during the
EIA study and pre-construction phase monitoring to allow fair comparison of
marine mammal monitoring results.
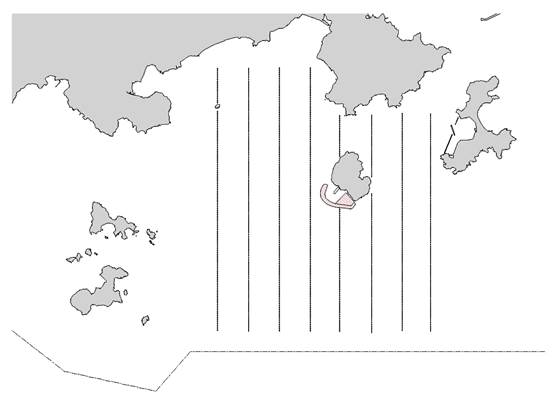
6.1.1.2
Eight
transect lines are set at Southeast Lantau survey area, including Shek Kwu
Chau, waters between Shek Kwu Chau and the Soko Islands, inshore waters of
Lantau Island (e.g. Pui O Wan) as well as southwest corner of Cheung Chau as
shown in Figure 6.1 below:
|
|
Figure 6.1 Line Transects for Marine Mammal Surveys
|
6.1.1.3
In
comparison to the baseline monitoring results, results from the analyzed
construction phase monitoring data would allow the detection of any changes of
their usage of habitat, in response to the scheduled construction works.
6.1.2
Passive Acoustic Monitoring (PAM)
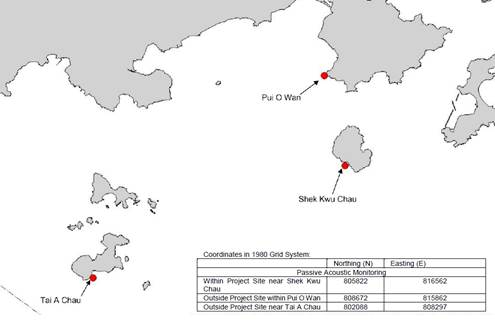
6.1.2.1
The
PAM aims to study the usage of an area by Finless Porpoise by using an array of
automated static porpoise detectors (e.g. C-POD) which would be deployed at
different locations to detect the unique ultra-high frequency sounds produced
by Finless Porpoise. During the construction period, the PAM survey will be
conducted including placement of two passive porpoise detectors outside the
Project Area as control site (i.e. within Pui O Wan and to the south of Tai A
Chau) and one porpoise detector within the Project Area (i.e. near Shek Kwu
Chau) as shown in Figure 6.2 below.
|
|
|
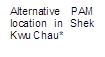
Note*: The alternative PAM device adjacent to the
Project site was deployed from 5 Mar to 11 Apr 2019, which contained a full
37 days acoustic monitoring data set. After the confirmation of loss of the
original PAM within the Project site, this data set was proposed to replace
that of the original one, as consulted with AFCD accordingly.
|
|
Figure 6.2 Locations of Passive Acoustic Monitoring
|
|
6.1.2.2
These
three detectors will be deployed on-site to carry out 24-hours monitoring for a
period listed as Table 6.1 below during the construction phase.
Table 6.1 PAM Deployment Period
|
Season
|
Months
|
Deployment Period
|
|
Peak Season
|
December, January, February, March, April or May
|
At least 30 days during the peak months of porpoise occurrence
in South Lantau waters
|
6.1.2.3
The
automated static porpoise detectors shall detect the presence and number of
finless porpoise and Chinese White Dolphins respectively over the deployment
period, with the false signal such as boat sonar and sediment transport noise
distinguished and filtered out. The detectors shall be deployed and retrieved
by professional dive team on the seabed of the three selected location shown in
Figure 6.2. During each deployment, the C-POD unit serial numbers as
well as the time and date of deployments shall be recorded. Information
including the GPS positions and water depth at each of the deployment locations
shall also be obtained.
6.1.2.4
The
diel patterns (i.e. 24-hour activity pattern) of finless porpoise occurrence
among the three sites at Shek Kwu Chau, Tai A Chau and Pui O Wan shall be
analyzed. Peaks and troughs of finless porpoise occurrence per hour of
day would be identified and compared with the results obtained from
pre-construction monitoring.
6.1.3
Land-based Theodolite Tracking
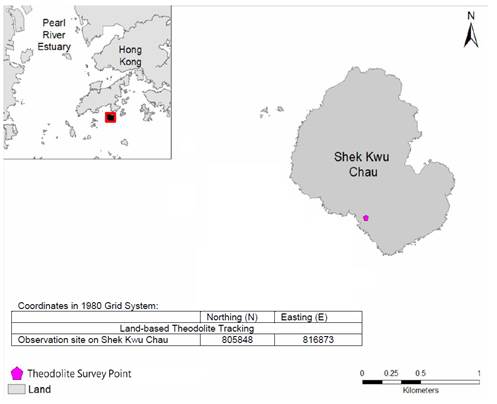
6.1.3.1
The
Land-based Theodolite Tracking study would use the same station as in the AFCD
monitoring study(same as the baseline monitoring location), which is situated
at the southwest side of Shek Kwu Chau (GPS position: 22o11.47¡¦ N
and 113o59.33¡¦ E) as shown in below Figure 6.3. The station
was selected based on its height above sea level (at least 20 metres), close
proximity to shore, and relatively unobstructed views of the entire Project
Area to the southwest of Shek Kwu Chau. The height of the Shek Kwu Chau Station
established by the HKCRP team is 74.6 m high at mean low water, and only a few
hundred metres to the IWMF reclamation site, which is ideal for the purpose for
the present behavioural and movement monitoring of finless porpoises as well
during construction phase considering there as an un-obstructed vantage point
at a height above the Project Site.
|
|
Figure 6.3 Locations of Land-based Theodolite Tracking
|
6.1.3.2
During
the construction phase, Land-based Theodolite Tracking will be carried out for
approximately six hours of tracking for each day of field work for a period
listed as Table 6.2 below, preferably at the initial stage of the
construction period (i.e. December 2018 to May 2019).
Table 6.2 Land-based Theodolite Tracking Survey
Period
|
Season
|
Months
|
Survey Period
|
|
Peak Season
|
December, January, February, March, April or May
|
30 days during the peak months of porpoise occurrence in South
Lantau waters
|
6.1.3.3
The
monitoring period for land-based theodolite tracking will be proposed to be
overlapped with the PAM. The monitoring team consists of one experienced
theodolite operator and at least two field observers for assistance. To conduct
theodolite tracking, the observers will search systematically for Finless
Porpoise using the unaided eye and 7 x 50 handheld binoculars on each survey
day throughout the study area. When an individual or group of porpoises is
located, a theodolite tracking session will be initiated and focal follow
methods will be used to track the porpoise(s). Behavioural state data (i.e.
resting, milling, travelling, feeding and socializing) shall also be recorded
every 5 minutes for the focal individual or group. Positions of porpoises and boats
shall be measured using a digital theodolite connected to a laptop computer.
This tracking survey will be conducted during the peak season between December
2018 and May 2019 for 30 surveys spanning across 15-16 weeks during the peak
season to provide good temporal coverage during the initial stage of the
construction period.
6.2
Specific
Mitigation Measures
6.2.1
Monitored exclusion zones
6.2.1.1
During
the installation/re-installation/relocation process of floating type silt
curtains, in order to avoid the accidental entrance and entrapment of marine
mammals within the silt curtains, a monitored exclusion zone of 250 m radius
from silt curtain should be implemented and monitored by competent Marine
Mammal Observers (MMOs). Marine Mammal Exclusion Zone (MMEZ) would also be
implemented for precautionary purpose for DCM works.
6.2.2
Marine mammal watching plan
6.2.2.1
Upon
the completion of silt curtain installation/re-installation/relocation, marine
mammal watching plan would be implemented to observe the presence of any
marine mammal around the localized silt curtain or being trapped by the
localized silt curtain.
6.3
Results
and Observations
6.3.1
Vessel-based Line-transect Survey
6.3.1.1
As
confirmed with Contractor and Project Supervising Officer, no marine
construction work will be carried out from March to December 2023 tentatively.
An updated EM&A arrangement to propose the temporary suspension of line
transect monitoring from March to December 2023 was submitted to EPD on
21 March 2023 and EPD had no comment on the updated EM&A arrangement on 29
March 2023. The line transect monitoring was then temporarily suspended from 30
March 2023 onward.
6.3.2
PAM and Land-based Theodolite
Tracking
6.3.2.1
30
days of PAM surveys were started at 1 May 2019 and completed until
the end of May 2019. Multiple PAM systems were deployed at three sites. The PAM
system located at the IWMF was lost, however, an alternative data set has been
identified. The PAM systems at the two control sites Tai A Chau and Pui O were
recovered on 3 August 2019. A summary of marine mammal detections shows that
porpoise were recorded every day of deployment at each site, but at varying
frequencies. The detailed theodolite result was presented in 17th
Monthly EM&A report (November 2019) while detailed PAM result was presented
in 18th Monthly EM&A report (December 2019).
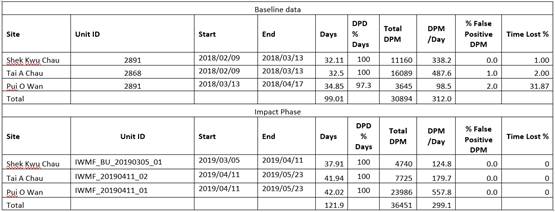
6.3.2.2
For
the baseline study, the DPM for each site was 11,160 (Shek Kwu Chau), 16,089
(Tai A Chau) and 3645 (Pui O Wan), totalling 30,894 DPM across all three sites,
compared to DPMs of 4740 (Shek Kwu Chau), 7725 (Tai A Chau) and 23,986 (Pui O
Wan), totalling 36,451 DPM, for the impact phase study. As the impact phase
study was longer than the baseline study, it is not appropriate to directly
compare total counts of DPM, however, the DPM rate (the average number of
detections per day) for each site can be more directly compared. During the
baseline study, Shek Kwu Chau averaged 338.2 DPM per day compared to 124.8 DPM
per day, during the impact phase study. This showed a decrease in the daily
average of porpoise detection at Shek Kwu Chau. During the baseline study, Tai
A Chau averaged 487.6 DPM per day compared to 179.7 DPM per day, during the
impact phase study. This showed a decrease in the daily average of porpoise
detection at Tai A Chau. During the baseline study, Pui O Wan averaged 98.5 DPM
per day compared to 557.8 DPM per day, during the impact phase study. This
showed a significant increase in the daily average of porpoise detections at
Pui O Wan (Table 6.3).
6.3.2.3
Overall,
the PAM study showed that porpoise continue to consistently utilise the Shek
Kwu Chau habitat immediately adjacent to the IWMF construction activities,
although to a lesser degree than that prior to construction activities. In
addition, the Pui O Wan site, which is 2.5 km away from the IWMF construction
area, was also consistently utilised during the impact phase PAM study. A
continued assessment of fine scale habitat use, particularly through PAM which
yields large quantities of data, would allow a more comprehensive assessment of
the EIA predictions.
Table 6.3 Summary Statistic Comparison of
Baseline (2018) and Impact Phase (2019) Passive Acoustic Monitoring
6.3.2.4
Theodolite
surveys were completed in May 2019. In total, 34 days of theodolite tracking
were completed between February - May 2019, comprising 167 hours and 49 minutes
of observation. No Chinese white dolphin was observed and only one finless was
recorded. The finless porpoise encounter rate was calculated as 0.006 finless
porpoise per hour, in all weather conditions.
6.3.2.5
A
total of 2620 vessels of ten different types were observed and tracked within
or in the proximity of the IWMF construction site. These comprised fishing
boats (236), speed boats (29), container boats (155), government boats (22),
high speed ferries (53), others (13) and IWMF-Related construction platforms
(974), tug boats(240), transportation boats (363), construction boats (531) and
approximately 8 buoys were present marking the site boundary. The detailed
Land-based Theodolite Tracking Report was presented in 5th Quarterly
EM&A report and 17th Monthly EM&A report.
6.3.2.6
The
baseline theodolite tracking was conducted immediately prior to and during the
site preparation activities of the site. The baseline data records a decrease
in porpoise sightings as site preparation activities commenced and notes that
the decrease was most likely due to the onset of site preparation activities.
The impact theodolite tracking conducted for this study records a marked
increase in the number of Project related vessels and platforms and, in
agreement with baseline conclusions, shows a concomitant decrease in finless
porpoise sightings.
7.
White-Bellied Sea Eagle
7
7.1
WBSE
Monitoring Parameters
7.1.1
The objective of the construction phase
monitoring should be to verify the utilisation of the area by WBSE, their
responses to construction disturbance, as well as the effectiveness of the
proposed mitigation measures. Throughout the construction phase, field surveys
should be conducted twice per month during their core breeding season (from
December to May), and once per month outside their core breeding season (from
June to November). The monitoring frequency should be increased to weekly
during the incubation period of each year. In order to confirm their foraging
ground near the construction site, it is necessary to conduct daily monitoring
during the first week of nestling period in each year.
7.1.2
Since the location of the WBSE nest was located
at the southwest of SKC within the hillside shrubland, it is impossible to
observe the eggs during incubation period. Therefore, monitoring with increased
frequency during incubation period could not be carried out. Daily monitoring
will be carried out once any chick is recorded during the monitoring day.
7.2
Results
and Observations
7.2.1
7-day consecutive monitoring was conducted from
29 March 2023 to 4 April 2023 and the April 2023 construction phase monitoring
were conducted on 12 and 26 April 2023. During the whole monitoring survey
period, the two adult WBSEs and one chick were recorded. No abnormal behaviour
of the recorded for both adults and chick during the 7-day consecutive
monitoring.
7.2.2
Five monitoring surveys
for monthly construction phase were conducted during
the reporting period, four of the monitoring surveys were conducted during their core breeding season (between December to May) and one of the monitoring survey was conducted outside
their core breeding season (between June to November). Since there is no
landing point along the western part of SKC, boat survey was used for the
monitoring survey. In order to increase the chance of finding the WBSEs,
monitoring survey was carried out either early in the morning or later in the
afternoon. The weather conditions of monitoring survey were shown in Table
7.1.
Table 7.1 Weather Conditions during the WBSE Monitoring (Monthly)
|
Date
|
Condition
|
Temperature (¢J)
|
|
26 October 2023
|
-
Northeast
wind force 4 to 5
-
Sunny
|
29
|
|
28 November 2023
|
-
Northeast
wind force 4 to 5
-
Sunny
|
22
|
|
13 December 2023
|
-
Northeast
wind force 4 to 5
-
Sunny
Day
|
23
|
|
27 December 2023
|
-
Northeast
wind force 4 to 5
-
Sunny
Day
|
24
|
7.2.3
Two adult WBSEs were recorded near Shek Kwu Chau
area in October, November and December 2023. No abnormal behaviours of the
adults were recorded during October, November and December 2023 construction
phase monitoring. All construction works during the monitoring period did not
show any impact to the WBSE.
7.2.4
The juvenile recorded in 2022 and 2023 has not
been observed since monitoring event in September 2022 and September 2023
respectively, it is suggested that the juvenile left the nest at SKC and
nesting in other area outside our monitoring boundary.
7.2.5
No disturbances from anthropogenic activities on
the island were recorded during the monitoring survey. No invasion of other
fauna species was recorded as well.

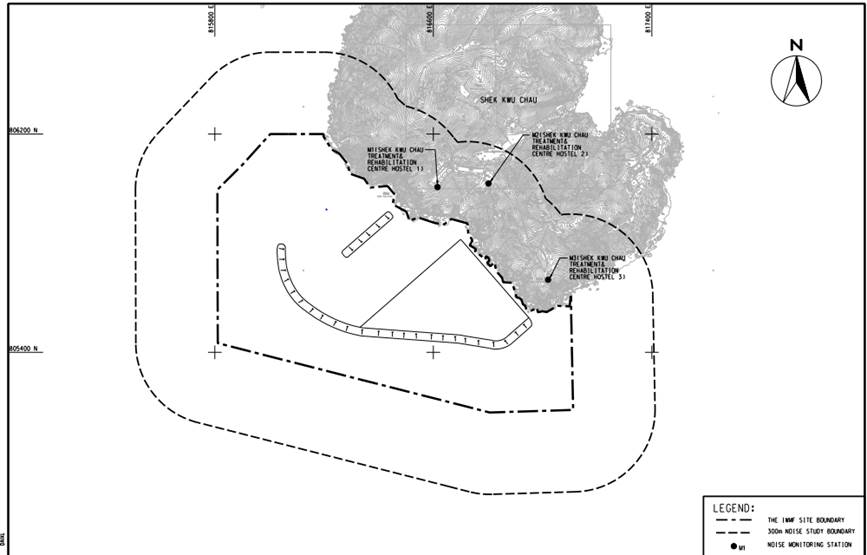
Figure 7.1 Location of WBSE Nest on SKC
7.2.6
No invasion of other fauna species was recorded
and no sign of using the construction site as a foraging ground was recorded as
well.
7.2.7
Photo records of the WBSE taken during the
reporting period are presented in Appendix F.
8.
Summary of Monitoring Exceedance, Complaints,
Notification of Summons and Prosecutions
8
8.1
No
exceedance of the Action and Limit Levels of the regular construction noise, coral
and WBSE monitoring was recorded during the reporting period.
8.2
No
environmental complaint was received in the reporting period.
8.3
No
notification of summon or prosecution was received since commencement of the
Contract.
8.4
Statistics
on complaints, notifications of summons and successful prosecutions are
summarized in Appendix G.
9.
EM&A Site Inspection
9
9.1
Site
inspections were carried out on a weekly basis to monitor the implementation of
proper environmental pollution control and mitigation measures under the
Contract. Site inspections were carried out at the Site Portions 1, 1A, 1B during
the reporting period.
Portions 1, 1A & 1B were the sites near SKC within the Site boundary.
9.2
Joint
site inspection with IEC was carried out on a monthly basis.
9.3
Minor
deficiencies were observed during weekly site inspection. Key observations
during the site inspections are summarized below:
¡P
Prevention
actions for oil/chemical spillage were not carried out properly;
¡P
Chemical
was not stored properly at designated storage place;
¡P
Non-road
Mobile Machinery (NRMM) label was not displayed properly and faded NRMM
label should be replaced;
¡P
Wastewater
was not treated before discharge;
¡P
Improper
deployment of geotextile;
¡P
C&D
waste and general waste was stored separately;
¡P
Insufficient
maintenance and cleaning for internal drainage works; and
¡P
General
waste was not stored inside the enclosed rubbish bin and housekeeping was not
maintained.
9.4
The
Contractor had rectified all of the observations identified during
environmental site inspections in the reporting period.
9.5
According
to the EIA Study Report, Environmental Permit, contract documents and Updated EM&A
Manual, the mitigation measures detailed in the documents, except the silt
curtain system, are implemented as much as practical during the reporting
period. An updated Implementation Status of Environmental Mitigation Measures
(EMIS) is provided in Appendix B.
10. Conclusion
and Recommendations
10
10.1
This
22nd Quarterly Environmental Monitoring and Audit (EM&A) Report summarizes
the EM&A works undertaken during the period from 1 October 2023 to 31 2023
in accordance with the Updated EM&A Manual and the requirement under EP-
429/2012/A and FEP-01/429/2012/A.
10.2
Construction
noise, water quality, construction waste, coral, marine mammal and
White-Bellied Sea Eagle (WBSE) monitoring were carried out in the reporting
period. No project-related exceedance of the Action and Limit Levels was
recorded during the reporting period.
10.3
Weekly
environmental site inspections were conducted during the reporting period.
Environmental deficiencies were observed during site inspection and were
rectified.
10.4
According
to the environmental site inspections performed in the reporting period, the
Contractor was reminded to pay attention on on-site housekeeping, the proper
storage of the chemicals, chemical waste and construction waste, dust control measure for
belt
conveyor system,
proper NRMM labelling, proper deployment of geotextile and proper wastewater
handling.
10.5
As
confirmed with Contractor and Project Supervising Officer, no marine
construction work will be carried out from March to December 2023 tentatively.
EPD advised no comment on the updated EM&A arrangement regarding temporarily
suspension of water quality and line-transect monitoring on 29 March 2023. The
water quality and line-transect monitoring were then temporarily suspended from
30 March 2023 onward. The water quality monitoring and line-transection
monitoring will be resumed upon the resumption of marine construction works.
10.6 No environmental
complaint was received in the reporting period.
10.7
No
notification of summon or prosecution was received since commencement of the
Contract.
10.8
The
ET will keep track on the construction works to confirm compliance of environmental
requirements and the proper implementation of all necessary mitigation
measures.