Revision History
|
C |
Revised as per EPDs comments with the inclusion of wet season baseline monitoring |
21 September 2018 |
|
B |
Revised as per EPDs comments with the inclusion of DCM baseline monitoring |
6 August 2018 |
|
A |
First Submission |
13 June 2018 |
|
Rev. |
Description of Modification |
Date |
Content
1.2 Purpose of the Baseline Monitoring Report
2. MARINE WATER QUALITY MONITORING
2.2 Water Quality Parameters, time and frequency
2.3 Water Quality Monitoring Locations
2.4 Baseline Monitoring Methodology
2.6 Maintenance and Calibration
3.2 Noise Monitoring Parameters, Time, Frequency and Duration
3.3 Noise Monitoring Locations
3.4 Baseline Monitoring Methodology
3.6 Maintenance and Calibration
5.1 Revision for Inclusion in the EM&A Documents
List of Appendices
|
Appendix A |
|
|
Appendix B |
|
|
Appendix C |
|
|
Appendix D |
|
|
Appendix E |
|
|
Appendix F |
|
|
Appendix G |
|
|
Appendix H |
|
|
Appendix I |
|
|
Appendix J |
|
|
Appendix K |
List of Figures
|
Figure 1.1 |
Overall view of IWMF alignment |
|
Figure 2.1 |
Water monitoring locations at Artificial Island near SKC |
|
Figure 3.1 |
Noise monitoring locations at SKC |
|
Figure 4.1 |
Line Transects for Marine Mammal Surveys |
|
Figure 4.2 |
Locations of Passive Acoustic Monitoring |
|
Figure 4.3 |
Location of Land-based Theodolite Tracking |
|
Figure 4.4 |
Distribution of finless porpoises (light blue dots) and Chinese White Dolphins (pink dots) during IWMF baseline monitoring surveys in Southeast Lantau survey area (February-April 2018), with transect lines shown |
|
Figure 4.5 |
Density of finless porpoises with corrected survey effort per km2 in Southeast Lantau survey area during IWMF baseline monitoring period (February-April 2018) |
|
Figure 4.6 |
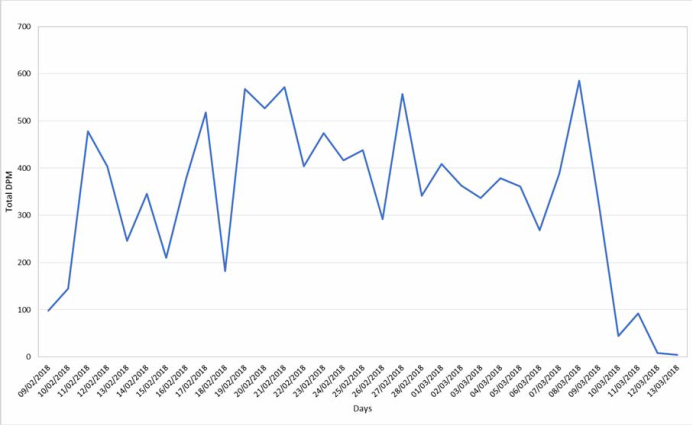
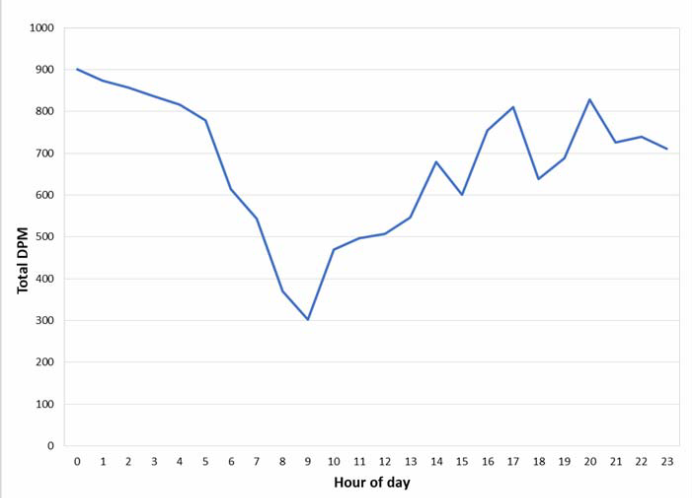
Total Porpoise DPM per day at SHEK KWU CHAU Site from February 9th to March 13th, 2018 |
|
Figure 4.7 |
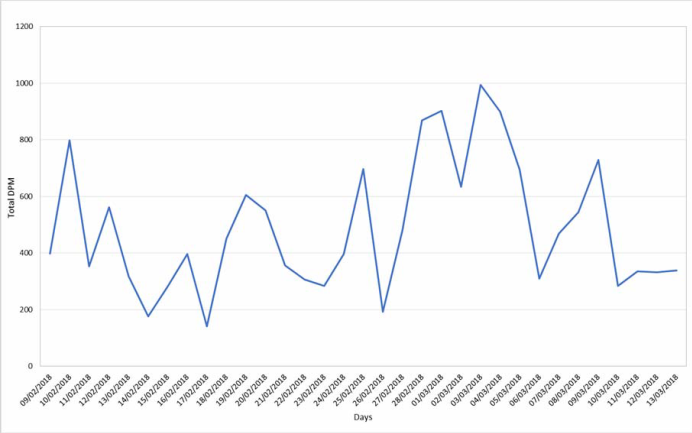
Total Porpoise DPM per day at TAI A CHAU Site from February 9th to March 13th, 2018 |
|
Figure 4.8 |
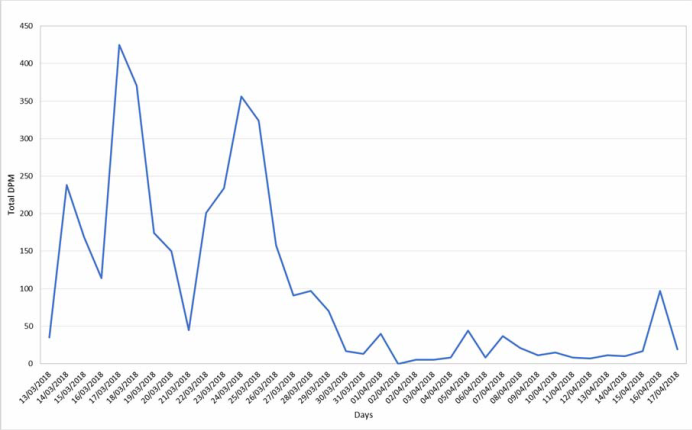
Total Porpoise DPM per day at PUI O WAN Site from March 13th to April 17th, 2018 |
|
Figure 4.9 |
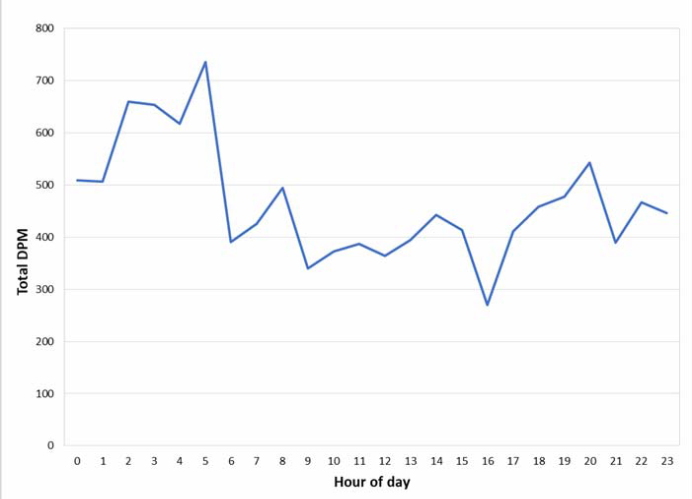
Porpoise DPM per hour of day at SHEK KWU CHAU Site from February 9th to March 13th, 2018 |
|
Figure 4.10 |
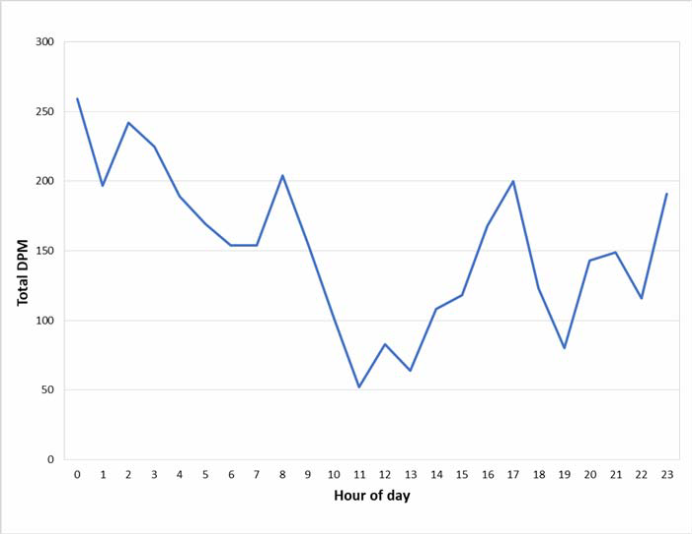
Porpoise DPM per hour of day at TAI A CHAU Site from February 9th to March 13th, 2018 |
|
Figure 4.11 |
Porpoise DPM per hour of day at PUI O WAN Site from March 13th to April 17th, 2018 |
|
Figure 4.12 |
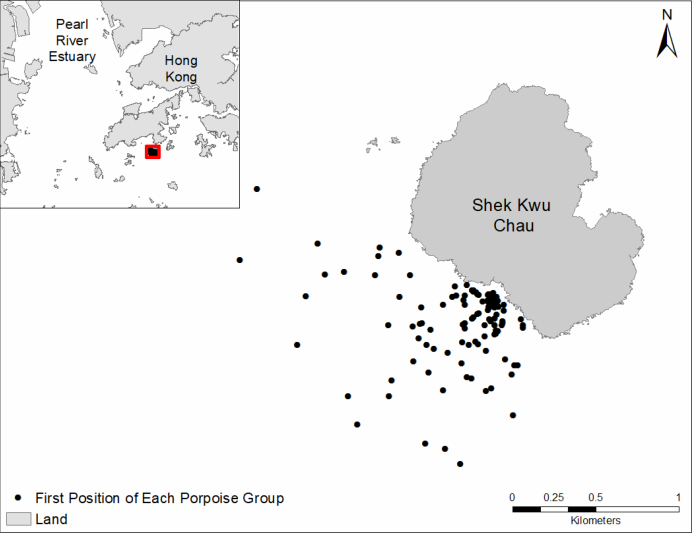
Plots of first sightings of all porpoise groups (prior to filtering out standardised segments) obtained from land-based station at Shek Kwu Chau during baseline monitoring theodolite tracking surveys in 2018 |
|
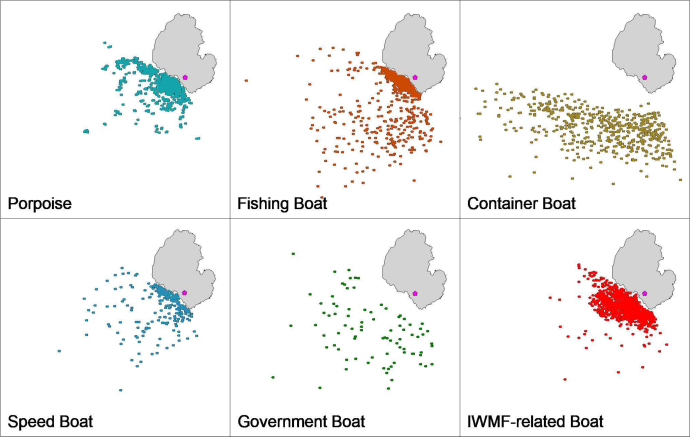
Figure 4.13 |
Plots of all fixed positions of finless porpoises and different boat types obtained from land-based station at Shek Kwu Chau during baseline monitoring theodolite tracking surveys in 2018 |
|
Figure 4.14 |
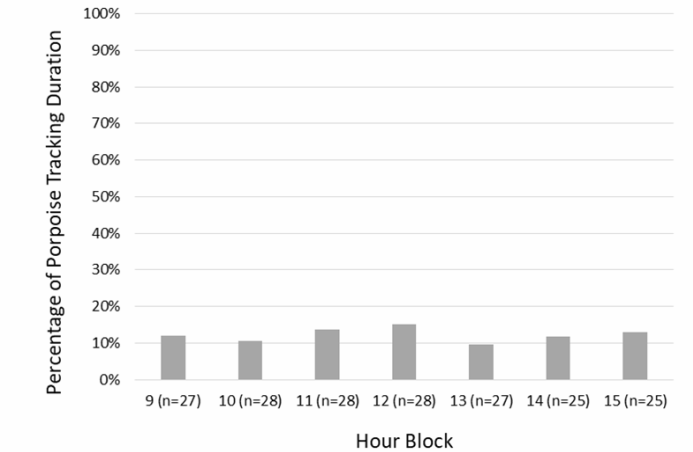
Percentages of porpoises group tracking duration of Shek Kwu Chau |
|
Figure 4.15 |
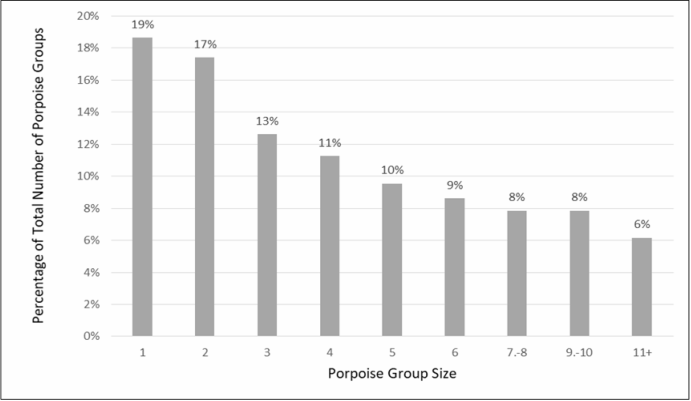
Percentages of varying group sizes of porpoises of Shek Kwu Chau |
|
Figure 4.16 |
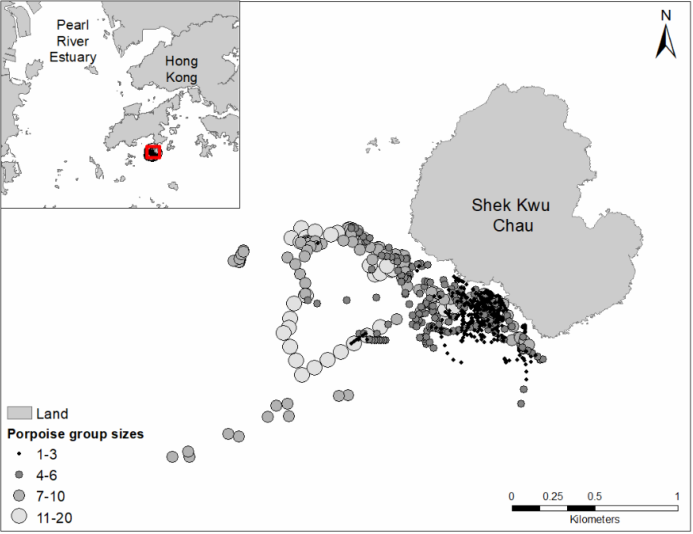
Plots of standardised porpoise group segments, based on group size, obtained from land-based station Shek Kwu Chau in 2018 |
|
Figure 4.17 |
Percentages of porpoise broad behavioural states recorded from Shek Kwu Chau, based on standardised segments |
|
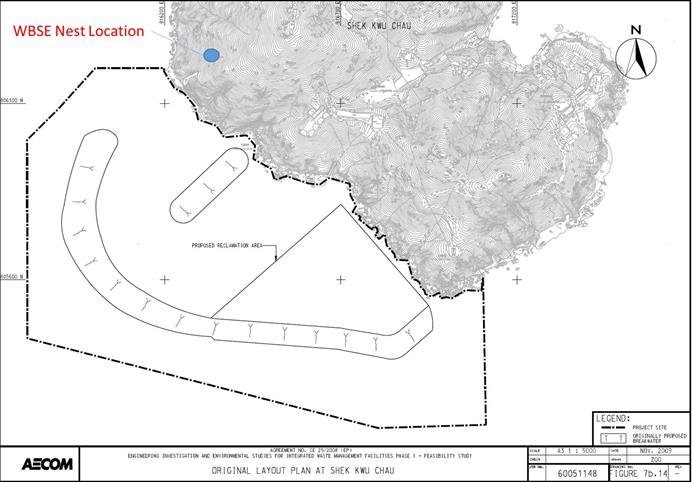
Figure 4.18 |
Location of Nest of WBSE |
The Project, Integrated Waste Management Facility (IWMF), is a Designated Project under the Environmental Impact Assessment Ordinance (Cap. 499) (EIAO) and is currently governed by a Further Environmental Permit (FEP No. FEP-01/429/2012/A) for the construction and operation of the Project.
In accordance with the approved Environmental Monitoring and Audit Manual (EM&A Manual) for the Project, baseline environmental monitoring for marine water quality, noise and ecology should be conducted prior to the commencement of construction works. Pursuant to FEP Condition 3.3, Baseline Monitoring Report shall be submitted to the Director of Environmental Protection at least 2 weeks before the commencement of construction of the Project. As the construction of Seawall and Deep Cement Mixing (DCM) is tentatively scheduled to commence in July 2018, baseline monitoring for marine water quality, noise and ecology were conducted according to the EM&A Manual before the commencement of construction works at selected locations at and around Shek Kwu Chau (SKC).
Baseline marine water quality monitoring for dry season was carried out between 26 February and 26 March 2018 at fourteen water quality monitoring locations. Data collected was reviewed and analysed to establish the Action and Limit Levels for water quality during impact monitoring period.
Marine water quality monitoring for wet season was conducted between 13 August 2018 and 7 September 2018. It is proposed to supplement the marine water quality monitoring data in wet season (April September) so as to further improve the baseline data to take into account potential variations within a year due to natural fluctuations and also enhance the representativeness of the water quality monitoring parameters.
The baseline monitoring for DCM was carried out between 24 May 2018 and 21 June 2018 at fourteen water quality monitoring locations prior to the commencement of DCM work as stated in the Detailed Plan on Deep Cement Mixing. Data collected was reviewed and analysed to establish the Action and Limit Levels for water quality during DCM works period.
The baseline monitoring for noise was carried out between 30 January 2018 and 13 February 2018 at the monitoring locations sited at SKC. Baseline noise monitoring was conducted for daytime (0700 1900 hrs), evening time (1900 2300 hrs) and night time (2300 0700 hrs). Data collected was reviewed and analysed to establish the background noise levels at the three monitoring location.
The baseline monitoring for ecology has three parts, the part of marine mammal was carried out between 30 January 2018 and 14 May 2018 at the monitoring transects and locations sited at SKC and surrounding waters; the part of white-bellied sea eagle (WBSE) was carried out between 30 January 2018 and 16 May 2018 at coastal area southwest of SKC; and the part of coral consists of (i) coral mapping and (ii) coral tagging and the REA survey during pre-construction phase, which (i) was carried out between 30 January 2018 and 22 February at the coastal area of SKC and the survey result has been reported in the Coral Translocation Plan. (ii) will be carried out within site boundary and coastal area of Tai A Chau within 2 weeks from the commencement of construction work as stated in the Coral Monitoring Plan, and be reported in the Baseline Report for Construction Phase Coral Monitoring.
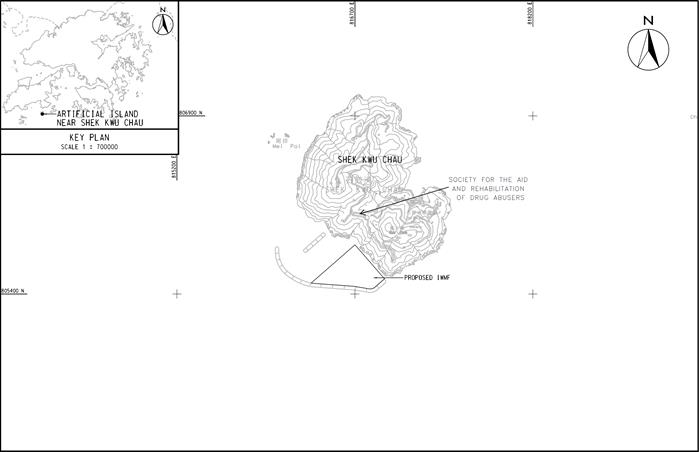
1. INTRODUCTION 1.1 Background 1.1.1 The Government of Hong Kong SAR will develop the Integrated Waste Management Facilities (IWMF) Phase 1 (hereafter the Project) with incineration to achieve substantial bulk reduction of unavoidable municipal solid waste (MSW) and to recover energy from the incineration process. The IWMF will be on an artificial island to be formed by reclamation at the south-western coast of Shek Kwu Chau. Keppel Seghers Zhen Hua Joint Venture (KSZHJV) was awarded the contract under Contract No. EP/SP/66/12 Integrated Waste Management Facilities Phase 1 to construct and operate the Project. 1.1.2 An environmental impact assessment (EIA) study for the Project have been conducted and the EIA Report was approved under the Environmental Impact Assessment Ordinance on 17 January 2012. An Environmental Permit (EP) (EP No.: EP-429/2012) was granted to EPD on 19 January 2012 for the construction and operation of the Project. Subsequently, the EP was amended (EP No.: EP-429/2012/A) and a further EP (FEP) (EP No.: FEP-01/429/2012/A) was granted to the Keppel Seghers Zhen Hua Joint Venture (KSZHJV) on 27 December 2017. 1.1.3 According to the EM&A Manual, baseline environmental monitoring for marine water quality, noise and ecology should be conducted to review the baseline conditions prior to the commencement of construction works for IWMF and establish Action and Limit Levels. 1.1.4 Given that the construction of seawall is tentatively scheduled to commence in June 2018, baseline environmental monitoring at the monitoring locations sited in the vicinity of the works areas at selected locations at and around Shek Kwu Chau (SKC) had commenced in January 2018 and was completed in May 2018. 1.1.5 Marine water quality monitoring data in wet season (April September) was conducted in August and September 2018 to further improve the baseline data to take into account potential variations within a year due to natural fluctuations and also enhance the representativeness of the water quality monitoring parameters. 1.1.6 Pursuant to Condition 3.3 of the FEP, the KSZHJV shall submit a Baseline Monitoring Report at least 2 weeks before the commencement of construction of the Project. 1.1.7 The overall view of IWMF alignment is shown in Figure 1.1
|
|
Figure 1.1 Overall view of IWMF alignment |
· Summarise and present the findings of baseline marine water quality, noise and ecology monitoring, including monitoring locations, equipment, period, methodology, results and observations; and
· Establish the Action and Limit (A/L) levels in accordance with the EM&A Manual for the subsequent impact monitoring during construction stage.
1.2.2 General Baseline water quality monitoring for dry season, wet season and DCM works were carried at fourteen monitoring stations, which are located at and around SKC. This Baseline Monitoring Report contains baseline findings of these fourteen monitoring stations.Noise
1.2.3 Baseline noise monitoring was carried out at three monitoring stations, which are located at SKC. This Baseline Monitoring Report contains baseline findings of these three monitoring stations.Ecology
1.2.4 Baseline ecological monitoring was carried out for marine mammal and white-bellied sea eagle at and around SKC. This Baseline Monitoring Report contains baseline findings of these ecological surveys.· Section 1 introduces the background of the Project and purpose of this Report;
· Section 2 presents the baseline monitoring methodologies, requirements, results, influencing factors, as well as determination of the action and limit levels of marine water quality; and
· Section 3 presents the baseline monitoring methodologies, requirements, results, influencing factors, as well as determination of the action and limit levels of noise; and
· Section 4 presents the baseline summary of the ecological survey; and
· Section 5 concludes the findings of baseline monitoring.
2. MARINE WATER QUALITY MONITORING 2.1 Monitoring Requirements 2.1.1 To ensure no adverse water quality impact, water quality monitoring is recommended to be carried out at the nearby water sensitive receivers (WSRs) during construction phase including proposed reclamation, breakwater construction and installation of submarine cables. 2.1.2 In accordance with the EM&A Manual, and Detailed Plan on Deep Cement Mixing, baseline water quality monitoring for dry season, wet season and DCM works should be conducted 3 days per week for 4 weeks to obtain background water quality levels at fourteen monitoring stations. The interval between two sets of monitoring has not been less than 36 hours. 2.1.3 Baseline monitoring for DCM was conducted prior to the commencement of DCM work as stated in the Detailed Plan on Deep Cement Mixing. 2.1.4 Details of Baseline monitoring for wet season was is stated in the Proposal for Review Baseline Marine Water Quality in Appendix A. 2.2 Water Quality Parameters, time and frequency 2.2.1 Baseline Marine Water Quality Monitoring for Dry Season was conducted 3 days per week for 4 weeks between 26 February 2018 and 23 March 2018, with an additional monitoring on 26 March 2018 prior to commencement of construction of the Project. 2.2.2 Baseline Marine Water Quality Monitoring for Wet Season was conducted 3 days per week for 4 weeks between 13 August 2018 and 7 September 2018 in the period during cement mixed marine sediment to grow 28 days strength prior to conducting UCS test to represent the baseline monitoring data for wet season. At that period of time, the key construction activities was operated at most 3 nos. of drill rigs for site investigation works. No marine construction works was undertaken. 2.2.3 Dissolved oxygen (DO), turbidity, suspended solids (SS) levels, salinity, pH and temperature were monitored at all monitoring stations during mid-flood and mid-ebb tides at three water depths for Baseline Marine Water Quality Monitoring for both Dry Season and Wet Season. 2.2.4 Baseline water quality monitoring for DCM was conducted 3 days per week for 4 weeks between 24 May 2018 and 19 June 2018, with an additional monitoring on 21 June 2018 prior to the commencement of the construction of DCM works. Total Alkalinity level, Water Current Velocity and Water Current Direction were monitored at all monitoring stations during mid-flood and mid-ebb tides at three water depths. 2.2.5 Table 2.1 summarizes the monitoring parameters, frequency and duration of the baseline water quality monitoring. The monitoring location/position, time, water depth, sampling depth, tidal stages, weather conditions and any special phenomena or work underway nearby were also recorded. The monitoring schedule is provided in Appendix B.
Table 2.1 Water Quality Monitoring Parameters, Frequency and Duration
|
Parameter, unit |
Frequency |
No. of Depths |
|
· Water Depth(m) · Temperature(oC) · Salinity(ppt) · pH (pH unit) · Dissolved Oxygen (DO)(mg/L and % of saturation) · Turbidity(NTU) · Suspended Solids (SS), mg/L · Total Alkalinity, mg/L · Current Direction, NSWE · Current Velocity, m/s |
Baseline monitoring: 3 days per week, at mid-flood and mid-ebb tides, for a period of 4 weeks
|
3 water depths: 1m below sea surface, mid-depth and 1m above sea bed. If the water depth is less than 3m, mid-depth sampling only. If water depth less than 6m, mid-depth may be omitted.
|
|
|
Figure 2.1 Water monitoring locations at Artificial Island near SKC |
Table 2.2 - Locations of Marine Water Quality Stations
|
Monitoring station |
Description |
Easting |
Northing |
|
B1 |
Beach - Cheung Sha Lower |
813342 |
810316 |
|
B2 |
Beach - Pui O |
815340 |
811025 |
|
B3 |
Beach - Yi Long Wan |
817210 |
808395 |
|
B4 |
Beach - Tai Long Wan |
817784 |
808682 |
|
H1 |
Horseshoe Crab - Shek Kwu Chau |
816477 |
806953 |
|
C1 |
Control Station |
810850 |
806288 |
|
C2 |
Control Station |
819421 |
808053 |
|
F1 |
Cheung Sha Wan Fish Culture Zone |
818631 |
810966 |
|
S1 |
Submarine Cable Landing Site |
814245 |
810335 |
|
S2 |
Submarine Cable |
815076 |
807747 |
|
S3 |
Submarine Cable Landing Site |
816420 |
805621 |
|
CR1 |
Coral |
817144 |
805597 |
|
CR2 |
Coral |
816512 |
805882 |
|
M1 |
Tung Wan |
821572 |
807799 |
In-situ Measurement
2.4.6 Levels of dissolved oxygen (DO), pH, temperature, turbidity and salinity were measured in-situ by portable and weatherproof measuring instrument, YSI ProDSS and Horiba U-53 Multiparameter complete with cable and sensor. (Refer to http://www.ysi.com/ProDSS for YSI ProDSS technical specification and http://www.horiba.com/process-environmental/products/water-treatment-environment/details/u-50-multiparameter-water-quality-checker-368/ for Horiba U-53 technical specification ). Water current velocity and Water Current direction were measured in-situ by portable and weatherproof measuring instrument, SonTek Hydrosurveyor (Refer to https://www.sontek.com/media/pdfs/riversurveyor-s5-m9-brochure.pdf for SonTek Hydrosurveyor M9 technical specification). Parameters measured by in-situ measurement is tabulated in Table 2.3Table 2.3 - Parameters Measured by In-situ Measurement
|
Parameter |
Resolution |
Range |
|
Temperature |
0.1 oC |
-5-70 oC |
|
Dissolved Oxygen (DO) |
0.01 mg/L |
0-50.0 mg/L |
|
Turbidity |
0.1 NTU |
0-1000 NTU |
|
pH |
0.01 pH |
pH 0-14 |
|
Salinity |
0.01 ppt |
0-40 ppt |
|
Water Current Velocity |
0.001m/s |
±20m/s |
|
Water Current Direction |
±1o |
0-360 o |
Laboratory Analysis
2.4.7 Analysis of suspended solids (SS) and Total Alkalinity level were carried out in a HOKLAS accredited laboratory, as shown in Appendix D. Sufficient water samples were collected at the monitoring stations for carrying out the laboratory determinations. The determination work was started within 24 hours after collection of the water samples. Analytical methods and detection limits for SS and Total Alkalinity are present in Table 2.4.
Table 2.4 - Analytical Methods Applied to Water Quality Samples
|
Parameter |
Analytical method |
Detection Level |
|
Suspended Solids, SS |
APHAi 2540 D |
1 mg/L |
|
Total Alkalinity |
APHA 2320 |
0.01 mg/L |
i. "APHA" stands for American Public Health Association Standard Methods for the Examination of Water and Wastewater, 23rd Edition.
Field Log
2.4.8 Other relevant data was recorded, such as: monitoring location / position, time, water depth, weather conditions and any special phenomena underway near the monitoring station.2.5 Monitoring Equipment 2.5.1 Equipment used in the baseline water quality monitoring programme is summarized in Table 2.5 below. Calibration certificates for the water quality monitoring equipment are attached in Appendix E.
Table 2.5 Baseline Water Quality Monitoring Equipment
|
Monitored Parameter |
Equipment |
Brand and Model |
|
DO, Temperature, Salinity, pH and Turbidity |
Multi-functional Meter |
YSI ProDSS Horiba U53 |
|
Coordinates |
Positioning Equipment |
Garmin GPSMAP 78s |
|
Water depth |
Water Depth Detector |
Hummingbird 160 Portable |
|
SS, Alkalinity Level |
Water Sampler |
Wildco 2 L Water Sampler with messenger |
|
Water Current Velocity & Direction |
Current Meter |
SonTek Hydrosurveyor |
2.5.2 Dissolved Oxygen and Temperature Measuring Equipment
The instrument was a portable and weatherproof DO probe mounted on the multi-functional meter complete with cable and sensor, and use a DC power source. The equipment was capable of measuring:
l A DO level in the range of 0 ‑ 50 mg/L; and
l Temperature of -5 ‑ 70 degree Celsius.
2.5.3 Turbidity Measurement Instrument
The instrument was a portable and weatherproof turbidity-measuring probe mounted on the multi-functional meter using a DC power source. It had a photoelectric sensor capable of measuring turbidity between 0 - 1000 NTU.
2.5.4 pH Measurement Instrument
The probe was consisted of a potentiometer, a glass electrode, a reference electrode and a temperature-compensating device mounted on the multi-functional meter. It was readable to 0.1 pH in a range of 0 to 14. Standard buffer solutions of at least pH 7 and pH 10 were used for calibration of the instrument before and after use.
2.5.5 Salinity Measurement Instrument
A portable salinometer mounted on the multi-functional meter capable of measuring salinity in the range of 0-40 parts per thousand (ppt) was provided for measuring salinity of the water at each monitoring location.
2.5.6 Current Meter
A portable, electronic current meter having equivalent functions and performance as Valeport 108 MKIII current meter was used for measuring current velocity and direction.
2.5.7 Sampler
The water sampler comprised a transparent PVC cylinder, with a capacity of not less than 2 litres, which can be effectively sealed with latex cups at both ends. The sampler have a positive latching system to keep it open and prevent premature closure until released by a messenger when the sampler is at the selected water depth.
2.5.8 Sample Containers and Storage
Water samples for SS were stored in high density polythene bottles with no preservative added, packed in ice (cooled to 4°C without being frozen) and delivered to the laboratory and analysed as soon as possible after collection. Sufficient volume of samples was collected to achieve the detection limit stated in Table 2.4.
2.5.9 Water Depth Detector
A portable, battery-operated echo sounder was used for the determination of water depth at each designated monitoring station. This unit could either be hand held or affixed to the bottom of the work boat, if the same vessel is to be used throughout the monitoring programme.
2.5.10 Monitoring Position Equipment
Hand-held digital Differential Global Positioning System (DGPS) with way point bearing indication and Radio Technical Commission for maritime (RTCM) Type 16 error message screen pop-up facilities (for real-time auto-display of error messages and DGPS corrections from the Hong Kong Hydrographic Office) was provided and used to ensure that the water sampling locations were correct during the water quality monitoring work.
2.6 Maintenance and Calibration 2.6.1 The multi-functional meters were checked and calibrated before use. Multi-functional meters were certified by a laboratory accredited under HOKLAS or any other international accreditation scheme, and subsequently re-calibrated at three monthly intervals throughout all stages of the water quality monitoring. Responses of sensors and electrodes were checked with certified standard solutions before each use. Wet bulb calibration for a DO meter was carried out before commencement of monitoring and after completion of all measurements each day. Calibration was not conducted at each monitoring location as daily calibration is adequate for the type of DO meter employed. 2.6.2 Sufficient stocks of spare parts were provided and maintained for replacements when necessary. Backup monitoring equipment was prepared for uninterrupted monitoring during equipment maintenance or calibration during monitoring. 2.7 Results and Observations
2.7.1 Baseline Marine Water Quality for Dry Season was conducted from 26 February 2018 to 26 March 2018, Baseline Marine Water Quality for Wet Season was conducted from 13 August 2018 to 7 September 2018 and Baseline Marine Water Quality for DCM was conducted between 24 May 2018 and 21 June 2018 at all fourteen monitoring stations. The monitoring results of Baseline Marine Water Quality for Dry Season, Wet Season and DCM are summarized in Table 2.6, Table 2.7 and Table 2.8 respectively. Details of water quality monitoring results are presented in Appendix C. 2.7.2 The weather conditions during the monitoring period were mainly sunny and cloudy. Sea conditions for the majority of monitoring days were either slight or moderate. No construction activity, major pollution source and extreme weather which might affect the results were observed during the baseline monitoring. 2.7.3 There is no significant difference between control and impact stations for the parameters monitored. 2.7.4 As the southern water is affected by seasonal changes, the baseline monitoring dry season has not taken into account the seasonal variations for determination of Action and Limit Level for WQM. Therefore, the marine water quality monitoring data in wet season (April September) was conducted as to further improve the baseline data to take into account potential variations within a year due to natural fluctuations and also enhance the representativeness of the water quality monitoring parameters. Considering the water quality monitoring results at the control points shall serve as a reference to determine if any elevated concentration of the monitored parameter is due to natural fluctuation or project contribution, revision on derivation criteria of the Action and Limit Level for WQM has therefore been made as specified in Section 5.1 of the report.
Table 2.6 Summary of Baseline Water Quality Monitoring Results (Dry Season)
|
Locations |
Parameters |
|||||||
|
Salinity (ppt) |
Dissolved Oxygen (mg/L) |
pH |
Turbidity (NTU) note ii |
Suspended Solids (mg/L) |
Temperature (oC) |
|||
|
Surface & Middle |
Bottom |
|||||||
|
B1 |
Avg. |
31.99 |
7.67 |
7.78 |
8.39 |
2.5 |
5 |
18.8 |
|
Min. |
30.74 |
7.15 |
7.15 |
7.37 |
0.6 |
2 |
17.5 |
|
|
Max. |
32.70 |
8.87 |
8.97 |
9.54 |
6.1 |
12 |
20.7 |
|
|
B2 |
Avg. |
31.82 |
7.75 |
7.71 |
8.36 |
2.6 |
5 |
18.9 |
|
Min. |
30.23 |
7.03 |
7.09 |
7.55 |
0.7 |
2 |
17.5 |
|
|
Max. |
32.60 |
9.32 |
9.41 |
9.54 |
12.8 |
9 |
20.3 |
|
|
B3 |
Avg. |
31.85 |
7.94 |
7.81 |
8.40 |
2.9 |
4 |
18.6 |
|
Min. |
29.62 |
7.12 |
7.03 |
7.62 |
0.6 |
2 |
17.2 |
|
|
Max. |
32.50 |
9.71 |
9.37 |
9.54 |
12.6 |
12 |
20.0 |
|
|
B4 |
Avg. |
31.79 |
7.96 |
9.32 |
8.37 |
2.2 |
4 |
18.6 |
|
Min. |
28.78 |
6.92 |
7.32 |
7.50 |
0.3 |
2 |
17.3 |
|
|
Max. |
32.79 |
9.59 |
9.10 |
9.99 |
14.7 |
12 |
20.1 |
|
|
C1 |
Avg. |
32.01 |
7.99 |
8.02 |
8.39 |
2.2 |
4 |
18.5 |
|
Min. |
30.50 |
7.04 |
7.05 |
7.61 |
0.2 |
2 |
17.1 |
|
|
Max. |
32.99 |
8.90 |
8.97 |
9.68 |
13.7 |
10 |
21.0 |
|
|
C2 |
Avg. |
31.86 |
7.95 |
7.92 |
8.28 |
2.5 |
5 |
18.4 |
|
Min. |
30.13 |
6.67 |
6.60 |
6.91 |
0.6 |
2 |
12.8 |
|
|
Max. |
32.88 |
9.17 |
9.93 |
9.18 |
12.1 |
11 |
21.2 |
|
|
CR1 |
Avg. |
31.88 |
7.99 |
7.94 |
8.32 |
2.4 |
4 |
18.3 |
|
Min. |
29.64 |
7.12 |
7.01 |
7.07 |
0.5 |
1 |
17.0 |
|
|
Max. |
32.80 |
9.32 |
9.87 |
9.19 |
13.4 |
10 |
20.9 |
|
|
CR2 |
Avg. |
32.11 |
8.21 |
8.30 |
8.37 |
2.7 |
4 |
18.3 |
|
Min. |
31.05 |
7.10 |
7.40 |
6.94 |
0.4 |
2 |
16.9 |
|
|
Max. |
32.93 |
10.65 |
10.35 |
9.18 |
13.6 |
11 |
20.0 |
|
|
F1 |
Avg. |
31.74 |
7.52 |
7.69 |
8.46 |
2.7 |
5 |
18.8 |
|
Min. |
29.99 |
6.99 |
7.04 |
7.61 |
1.0 |
2 |
17.3 |
|
|
Max. |
32.89 |
9.33 |
9.30 |
12.35 |
9.2 |
11 |
20.3 |
|
|
H1 |
Avg. |
32.03 |
8.04 |
8.04 |
8.34 |
1.7 |
5 |
18.4 |
|
Min. |
30.60 |
7.27 |
7.41 |
7.29 |
0.5 |
2 |
16.7 |
|
|
Max. |
32.96 |
9.34 |
9.66 |
9.50 |
5.7 |
8 |
19.9 |
|
|
M1 |
Avg. |
31.78 |
7.92 |
7.79 |
8.41 |
2.2 |
5 |
18.6 |
|
Min. |
29.20 |
7.08 |
7.06 |
6.89 |
0.4 |
2 |
17.2 |
|
|
Max. |
32.60 |
9.64 |
9.47 |
9.96 |
9.6 |
30 |
21.0 |
|
|
S1 |
Avg. |
31.93 |
7.88 |
7.83 |
8.37 |
2.8 |
4 |
18.7 |
|
Min. |
30.51 |
6.88 |
7.06 |
7.64 |
0.7 |
2 |
17.4 |
|
|
Max. |
32.70 |
9.06 |
9.46 |
9.65 |
17.9 |
10 |
20.1 |
|
|
S2 |
Avg. |
31.97 |
8.06 |
8.12 |
8.33 |
2.1 |
4 |
18.4 |
|
Min. |
29.20 |
7.11 |
7.52 |
7.22 |
0.5 |
2 |
16.9 |
|
|
Max. |
32.89 |
9.56 |
9.23 |
9.40 |
6.2 |
10 |
20.1 |
|
|
S3 |
Avg. |
32.01 |
8.19 |
8.18 |
8.34 |
2.0 |
4 |
18.3 |
|
Min. |
29.20 |
7.10 |
7.29 |
6.98 |
0.8 |
2 |
16.9 |
|
|
Max. |
32.70 |
10.99 |
10.81 |
9.16 |
10.0 |
9 |
20.2 |
|
Notes:
i. "Avg", Min and Max is the average, minimum and maximum respectively of the data from measurements conducted under mid-flood and mid-ebb tides at three water depths, except that of DO where the data for Surface & Middle and Bottom are calculated separately.
ii. Measurements of turbidity would be rounding to 0.1 NTU for proven accuracy as per the equipment specs during utilization of data.
Table 2.7 Summary of Baseline Water Quality Monitoring Results (Wet Season)
|
Locations |
Parameters |
|||||||
|
Salinity (ppt) |
Dissolved Oxygen (mg/L) |
pH |
Turbidity (NTU) note ii |
Suspended Solids (mg/L) |
Temperature (oC) |
|||
|
Surface & Middle |
Bottom |
|||||||
|
B1 |
Avg. |
27.98 |
8.68 |
8.56 |
8.21 |
2.2 |
6.64 |
28.9 |
|
Min. |
26.48 |
7.67 |
7.48 |
7.82 |
0.9 |
2.00 |
27.6 |
|
|
Max. |
31.13 |
10.23 |
10.44 |
8.42 |
4.4 |
12.00 |
31.1 |
|
|
B2 |
Avg. |
27.82 |
8.69 |
8.67 |
8.22 |
2.1 |
6.89 |
29.1 |
|
Min. |
26.62 |
7.40 |
7.58 |
7.92 |
1.2 |
2.00 |
27.8 |
|
|
Max. |
30.53 |
10.32 |
11.11 |
8.36 |
4.9 |
12.00 |
31.2 |
|
|
B3 |
Avg. |
27.92 |
8.88 |
8.75 |
8.19 |
2.1 |
6.82 |
28.9 |
|
Min. |
26.56 |
7.47 |
7.25 |
7.83 |
0.7 |
2.00 |
27.8 |
|
|
Max. |
30.55 |
13.31 |
13.24 |
8.37 |
4.3 |
15.00 |
31.2 |
|
|
B4 |
Avg. |
27.93 |
8.71 |
8.58 |
8.21 |
2.2 |
6.95 |
29.0 |
|
Min. |
26.53 |
7.53 |
7.30 |
7.83 |
1.0 |
3.00 |
27.8 |
|
|
Max. |
30.27 |
11.25 |
11.01 |
8.39 |
4.5 |
14.00 |
31.1 |
|
|
C1 |
Avg. |
28.04 |
8.59 |
8.39 |
8.21 |
2.2 |
6.90 |
28.9 |
|
Min. |
26.64 |
7.43 |
7.22 |
7.80 |
1.0 |
2.00 |
27.6 |
|
|
Max. |
32.80 |
10.42 |
10.44 |
8.41 |
4.4 |
15.00 |
31.2 |
|
|
C2 |
Avg. |
28.12 |
8.66 |
8.35 |
8.19 |
2.0 |
7.40 |
28.8 |
|
Min. |
26.52 |
7.34 |
7.21 |
7.78 |
0.1 |
2.00 |
27.5 |
|
|
Max. |
32.43 |
11.23 |
11.02 |
8.39 |
4.2 |
16.00 |
31.2 |
|
|
CR1 |
Avg. |
28.17 |
8.62 |
8.39 |
8.18 |
2.2 |
6.58 |
28.8 |
|
Min. |
26.68 |
7.19 |
7.19 |
7.73 |
0.4 |
3.00 |
27.0 |
|
|
Max. |
34.00 |
10.48 |
10.37 |
8.38 |
4.3 |
12.00 |
31.0 |
|
|
CR2 |
Avg. |
28.44 |
8.33 |
8.33 |
8.20 |
2.3 |
6.78 |
28.9 |
|
Min. |
26.67 |
7.15 |
7.15 |
7.96 |
1.1 |
3.00 |
27.8 |
|
|
Max. |
33.39 |
10.41 |
10.47 |
8.40 |
4.4 |
13.00 |
31.2 |
|
|
F1 |
Avg. |
28.28 |
8.48 |
8.38 |
8.20 |
2.0 |
6.89 |
28.9 |
|
Min. |
26.60 |
7.18 |
7.14 |
7.80 |
0.9 |
2.00 |
27.5 |
|
|
Max. |
32.70 |
10.44 |
10.35 |
8.38 |
4.3 |
13.00 |
31.1 |
|
|
H1 |
Avg. |
27.91 |
8.81 |
8.63 |
8.23 |
2.2 |
7.40 |
28.9 |
|
Min. |
26.54 |
7.63 |
7.59 |
7.86 |
1.1 |
2.00 |
27.6 |
|
|
Max. |
31.20 |
10.42 |
10.48 |
8.38 |
4.6 |
13.00 |
31.2 |
|
|
M1 |
Avg. |
28.25 |
8.52 |
8.37 |
8.20 |
2.1 |
6.64 |
28.9 |
|
Min. |
26.46 |
7.18 |
7.25 |
7.81 |
0.4 |
3.00 |
27.4 |
|
|
Max. |
32.30 |
10.49 |
10.34 |
8.39 |
4.4 |
14.00 |
31.2 |
|
|
S1 |
Avg. |
27.93 |
8.56 |
8.60 |
8.21 |
2.3 |
6.47 |
29.0 |
|
Min. |
26.53 |
7.57 |
7.55 |
7.89 |
1.3 |
2.00 |
27.6 |
|
|
Max. |
30.89 |
10.45 |
10.48 |
8.40 |
4.4 |
12.00 |
31.2 |
|
|
S2 |
Avg. |
28.13 |
8.62 |
8.59 |
8.22 |
2.0 |
6.81 |
28.9 |
|
Min. |
26.60 |
7.24 |
7.15 |
7.82 |
0.7 |
3.00 |
27.6 |
|
|
Max. |
32.40 |
10.49 |
14.49 |
8.41 |
4.2 |
17.00 |
31.2 |
|
|
S3 |
Avg. |
28.19 |
8.36 |
8.27 |
8.21 |
2.0 |
7.30 |
29.0 |
|
Min. |
26.53 |
7.28 |
7.31 |
7.76 |
0.8 |
3.00 |
27.3 |
|
|
Max. |
32.90 |
10.44 |
10.49 |
8.40 |
4.2 |
15.00 |
31.1 |
|
Notes:
i. "Avg", Min and Max is the average, minimum and maximum respectively of the data from measurements conducted under mid-flood and mid-ebb tides at three water depths, except that of DO where the data for Surface & Middle and Bottom are calculated separately.
ii. Measurements of turbidity would be rounding to 0.1 NTU for proven accuracy as per the equipment specs during utilization of data.
Table 2.8 Summary of Baseline Water Quality Monitoring Results (DCM)
|
Locations |
Parameters |
||
|
Alkalinity (mg/L) |
Velocity (m/s) |
||
|
B1 |
Avg. |
105.88 |
0.15 |
|
Min. |
95.00 |
0.00 |
|
|
Max. |
118.00 |
0.35 |
|
|
B2 |
Avg. |
105.15 |
0.13 |
|
Min. |
92.00 |
0.02 |
|
|
Max. |
117.00 |
0.41 |
|
|
B3 |
Avg. |
108.55 |
0.13 |
|
Min. |
98.00 |
0.02 |
|
|
Max. |
120.00 |
0.41 |
|
|
B4 |
Avg. |
105.97 |
0.15 |
|
Min. |
95.00 |
0.02 |
|
|
Max. |
122.00 |
0.41 |
|
|
C1 |
Avg. |
105.35 |
0.29 |
|
Min. |
94.00 |
0.02 |
|
|
Max. |
117.00 |
1.03 |
|
|
C2 |
Avg. |
105.86 |
0.22 |
|
Min. |
95.00 |
0.02 |
|
|
Max. |
117.00 |
1.03 |
|
|
CR1 |
Avg. |
105.65 |
0.20 |
|
Min. |
98.00 |
0.01 |
|
|
Max. |
117.00 |
0.63 |
|
|
CR2 |
Avg. |
104.89 |
0.23 |
|
Min. |
92.00 |
0.03 |
|
|
Max. |
116.00 |
0.57 |
|
|
F1 |
Avg. |
105.60 |
0.14 |
|
Min. |
96.00 |
0.01 |
|
|
Max. |
121.00 |
0.35 |
|
|
H1 |
Avg. |
105.22 |
0.23 |
|
Min. |
93.00 |
0.04 |
|
|
Max. |
121.00 |
0.56 |
|
|
M1 |
Avg. |
105.58 |
0.15 |
|
Min. |
95.00 |
0.02 |
|
|
Max. |
120.00 |
0.42 |
|
|
S1 |
Avg. |
105.77 |
0.16 |
|
Min. |
95.00 |
0.02 |
|
|
Max. |
119.00 |
0.31 |
|
|
S2 |
Avg. |
104.91 |
0.27 |
|
Min. |
96.00 |
0.03 |
|
|
Max. |
116.00 |
0.74 |
|
|
S3 |
Avg. |
104.75 |
0.28 |
|
Min. |
95.00 |
0.03 |
|
|
Max. |
116.00 |
0.74 |
|
Notes:
i. "Avg", Min and Max is the average, minimum and maximum respectively of the data from measurements conducted under mid-flood and mid-ebb tides at three water depths
2.8 Action and Limit Levels 2.8.1 The Action and Limit Levels have been set based on the derivation criteria specified in the EM&A Manual, with the proposed revision as specified in Section 5.1 as shown in Table 2.9 below.
Table 2.9 Criteria of Action and Limit Levels for Water Quality
|
Parameters |
Action |
Limit |
|
Construction Phase Impact Monitoring |
||
|
DO in mg/L |
≤ 5 %-ile of baseline data |
≤ 4 |
|
SS in mg/L |
≥ 95 %-ile of baseline data or 120% of control stations SS at the same tide of the same day of measurement, whichever is higher |
≥ 99 %-ile of baseline data or 130% of control station's SS at the same tide of the same day of measurement, whichever is higher |
|
Turbidity in NTU |
≥ 95 %-ile of baseline data or 120% of control stations turbidity at the same tide of the same day of measurement, whichever is higher |
≥ 99 %-ile of baseline data or 130% of control station's turbidity at the same tide of the same day of measurement, whichever is higher |
|
Operational Phase Impact Monitoring |
||
|
Salinity in ppm |
≥ 95 %-ile of baseline data or 105% of control stations salinity at the same tide of the same day of measurement, whichever is higher |
≥ 99 %-ile of baseline data or 109% of control stations salinity at the same tide of the same day of measurement, whichever is higher |
|
Intensive DCM Monitoring |
||
|
Total Alkalinity in mg/L
|
≥ 95 percentile of baseline data or 120% of representative control station at the same tide of the same day, whichever is higher
|
≥ 99 percentile of baseline data or 130% of representative control station at the same tide of the same day, whichever is higher
|
|
Regular DCM Monitoring |
||
|
Total Alkalinity in mg/L
|
≥ 95 percentile of baseline data or 120% of upstream control station at the same tide of the same day, whichever is higher
|
≥ 99 percentile of baseline data or 130% of upstream control station at the same tide of the same day, whichever is higher
|
i. "Depth-averaged" is calculated by taking the arithmetic means of reading of all three depths.
ii. For DO, non-compliance of the water quality limits occurs when monitoring result is lower than the limits.
iii. For turbidity, SS and Salinity, non-compliance of the water quality limits occurs when monitoring result is higher than the limits.
2.8.2 Based on the baseline monitoring data and the derivation criteria specified above, the Action/Limit Levels for Dry Season and Wet Season have been derived and are presented in Table 2.10 & 2.11 respectively.Table 2.10 Derived Action and Limit Levels for Water Quality (Dry Season)
|
Parameters |
Action |
Limit |
|
Construction Phase Impact Monitoring |
||
|
DO in mg/L |
≤ 7.13 |
≤ 4 |
|
SS in mg/L |
≥ 8 or 120% of control stations SS at the same tide of the same day of measurement, whichever is higher |
≥ 10 or 130% of control station's SS at the same tide of the same day of measurement, whichever is higher |
|
Turbidity in NTU |
≥ 5.6 or 120% of control stations turbidity at the same tide of the same day of measurement, whichever is higher |
≥ 12.8 or 130% of control station's turbidity at the same tide of the same day of measurement, whichever is higher |
|
Operational Phase Impact Monitoring |
||
|
Salinity in ppm |
≥ 32.6 or 105% of control stations salinity at the same tide of the same day of measurement, whichever is higher |
≥ 32.8 or 109% of control stations salinity at the same tide of the same day of measurement, whichever is higher |
|
Intensive DCM Monitoring |
||
|
Total Alkalinity in mg/L
|
≥ 116 mg/L or 120% of representative control station at the same tide of the same day, whichever is higher |
≥ 118 mg/L or 130% of representative control station at the same tide of the same day, whichever is higher
|
|
Regular DCM Monitoring |
||
|
Total Alkalinity in mg/L
|
≥ 116 mg/L or 120% of upstream control station at the same tide of the same day, whichever is higher
|
≥ 118 mg/L or 130% of upstream control station at the same tide of the same day, whichever is higher
|
Notes:
iv. "Depth-averaged" is calculated by taking the arithmetic means of reading of all three depths.
v. For DO, non-compliance of the water quality limits occurs when monitoring result is lower than the limits.
vi. For Turbidity, SS, Total Alkalinity and Salinity, non-compliance of the water quality limits occurs when monitoring result is higher than the limits.
Table 2.11 Derived Action and Limit Levels for Water Quality (Wet Season)
|
Parameters |
Action |
Limit |
|
Construction Phase Impact Monitoring |
||
|
DO in mg/L |
≤ 5.28 |
≤ 4 |
|
SS in mg/L |
≥ 12 or 120% of control stations SS at the same tide of the same day of measurement, whichever is higher |
≥ 14 or 130% of control station's SS at the same tide of the same day of measurement, whichever is higher |
|
Turbidity in NTU |
≥ 4.0 or 120% of control stations turbidity at the same tide of the same day of measurement, whichever is higher |
≥ 4.3 or 130% of control station's turbidity at the same tide of the same day of measurement, whichever is higher |
|
Operational Phase Impact Monitoring |
||
|
Salinity in ppm |
≥ 31.1 or 105% of control stations salinity at the same tide of the same day of measurement, whichever is higher |
≥ 32.4 or 109% of control stations salinity at the same tide of the same day of measurement, whichever is higher |
|
Intensive DCM Monitoring |
||
|
Total Alkalinity in mg/L
|
≥ 116 mg/L or 120% of representative control station at the same tide of the same day, whichever is higher |
≥ 118 mg/L or 130% of representative control station at the same tide of the same day, whichever is higher
|
|
Regular DCM Monitoring |
||
|
Total Alkalinity in mg/L
|
≥ 116 mg/L or 120% of upstream control station at the same tide of the same day, whichever is higher
|
≥ 118 mg/L or 130% of upstream control station at the same tide of the same day, whichever is higher
|
Notes:
i. "Depth-averaged" is calculated by taking the arithmetic means of reading of all three depths.
ii. For DO, non-compliance of the water quality limits occurs when monitoring result is lower than the limits.
iii. For turbidity, SS and Salinity, non-compliance of the water quality limits occurs when monitoring result is higher than the limits.
3. NOISE MONITORING 3.1 Monitoring Requirements 3.1.1 To ensure no adverse noise impact, noise monitoring is recommended to be carried out at the nearby noise sensitive receivers (NSRs) during construction phase. 3.1.2 In accordance with the EM&A Manual, baseline noise monitoring should be conducted for at least two weeks to obtain background noise levels prior to the commissioning of major construction works. 3.2 Noise Monitoring Parameters, Time, Frequency and Duration 3.2.1 Baseline noise was conducted between 30 January 2018 and 13 February 2018 (including Sunday and general holidays) prior to the commencement of the construction of the Project. 3.2.2 The baseline noise level was measured in terms of the A-weighted equivalent continuous sound pressure level (Leq) and the 10 and 90-percent exceeded level (L10, L90) as reference. At each designated monitoring location, measurements of 5-minutes A-weighted equivalent sound pressure level [Leq 5min] was conducted continuously from 9:30am of 30 January 2018 to 11:00am 13 February 2018, along with the measurements of L10 and L90 for each of the 5-minutes measurement. The measurement results are sorted in four time categories, namely (i) Daytime (0700-1900) on normal weekdays (not being a Sunday or general holidays), (ii) Daytime (0700-1900) on Sunday or general holidays (iii) Evening time (1900-2300), and (iv) Night time (2300-0700). For measurement during Daytime of normal weekdays, 30-minutes A-weighted equivalent sound pressure level (Leq 30min), calculating from logarithm average of 6 consecutive Leq 5min from field measurement, shall be used as the monitoring parameter. For measurement during Daytime of Sunday or general holiday, Evening time and Night time, Leq 5min shall be used as the monitoring parameter to align with the stipulated parameter in Technical Memorandum on Noise from Construction Work Other Than Percussive Piling. 3.2.3 Table 3.1 summarizes the monitoring parameters, frequency and duration of the baseline noise monitoring. The monitoring schedule is provided in Appendix F.
Table 3.1 Noise Monitoring Parameters, Time Catigories and Duration
|
Time Categories |
Duration |
Parameters |
|
Daytime: 0700-1900 hrs (during normal weekdays, not include Sunday or general holiday) |
9:30am of 30 January 2018 to 11:00am 13 February 2018 |
Leq 5min, Leq 30min (logarithm average of 6 consecutive Leq 5min), L10 5min & L90 5min |
|
Daytime: 0700-1900 hrs (Sunday or general holiday) |
||
|
Evening time: 1900-2300 hrs |
||
|
Night time: 2300-0700 hrs |
|
|
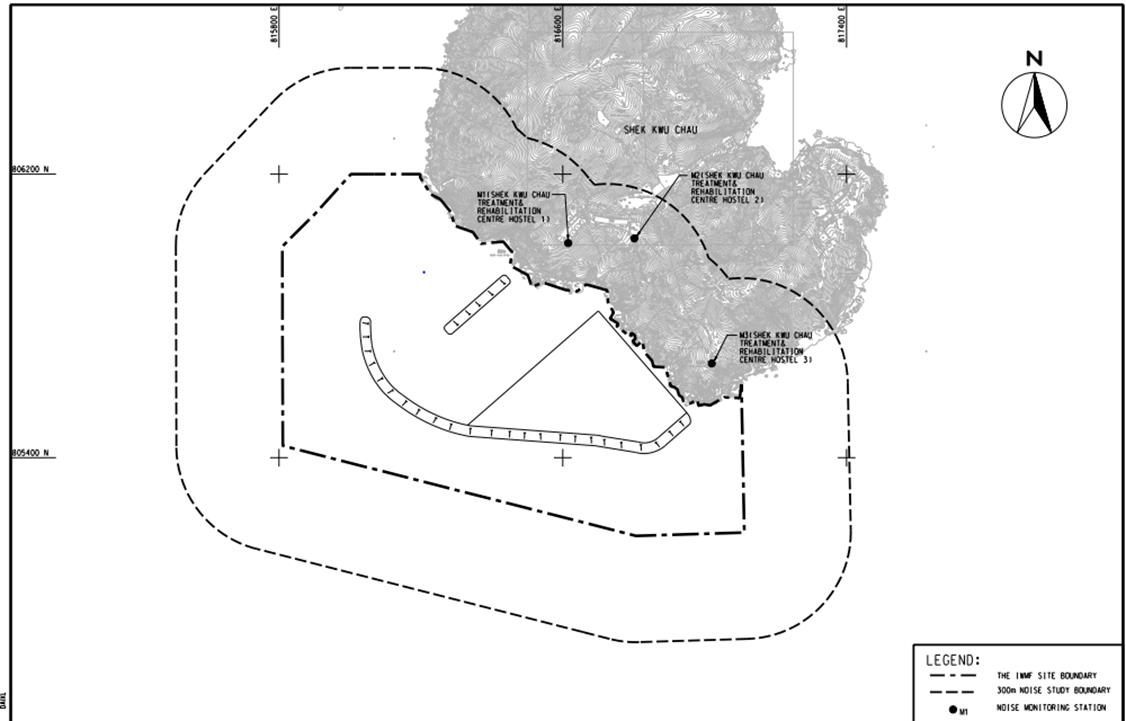
Figure 3.1 Noise monitoring locations at SKC |
Table 3.2 Noise Monitoring Location
|
Station |
NSR ID in EIA Report |
Noise Monitoring Location |
Type of sensitive receiver(s) |
Measurement Type |
|
M1 |
N_S1 |
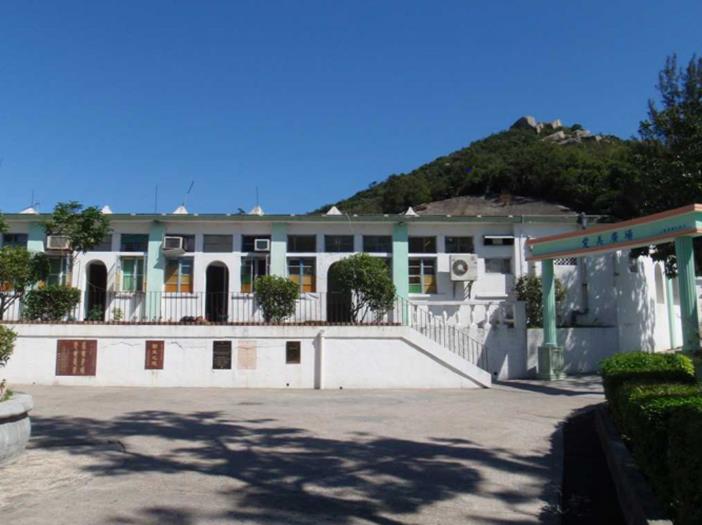
Shek Kwu Chau Treatment & Rehabilitation Centre Hostel 1 |
Residential |
Façade |
|
M2 |
N_S2 |
Shek Kwu Chau Treatment & Rehabilitation Centre Hostel 2 |
Residential |
Façade |
|
M3 |
N_S3 |
Shek Kwu Chau Treatment & Rehabilitation Centre Hostel 3 |
Residential |
Façade |
l The microphone head of the lead level meter was normally positioned 1m exterior of the noise sensitive façade and lowered sufficiently so that the buildings external wall acts as a reflecting surface.
l The battery condition was checked to ensure good functioning of the meter.
l Parameters such as frequency weighting, the time weighting and the measurement time were set as follows:
- Frequency weight: A
- Time weighting: Fast
- Measurement time: 5 minutes
l Prior to and after noise measurement, the meter was calibrated using the calibrator for 94.0 dB at 1000Hz. If the difference in the calibration level before and after measurement is more than 1.0 dB, the measurement was considered invalid and repeat of noise measurement was required after re-calibration or repair of the equipment.
l Noise monitoring was carried out continuously for 24 hours during the measurement period with the baseline sound level meter system. At the end of the monitoring period, noise levels in term of Leq, L10, and L90 were recorded. In addition, site conditions and noise sources were recorded when the equipment were checked and inspected.
l All the monitoring data within the sound level meter system was downloaded through the computer software.
3.5 Monitoring Equipment 3.5.1 Integrated sound level meter was used for the noise monitoring. The meter shall be in compliance with the International Electrotechnical Commission Publications 651: 1979 (Type 1) and 804: 1985 (Type 1) specifications. 3.5.2 Equipment used in the baseline noise monitoring programme is summarized in Table 3.3 below. Calibration certificates for the noise monitoring equipment are attached in Appendix G.Table 3.3 Baseline Noise Monitoring Equipment
|
Equipment |
Brand and Model |
|
Sound Level Meter |
Nti XL2 |
|
Sound Level Meter Calibrator |
Rion NC-74 |
l The microphone head of the sound level meter and calibrator were cleaned with a soft cloth at quarterly intervals.
l The sound level meter and calibrator were checked and calibrated at yearly intervals
l Immediately prior to and following each noise measurement the accuracy of the sound level meter shall be checked using an acoustic calibrator generating a known sound pressure level at a known frequency. Measurements may be accepted as valid only if the calibration levels from before and after the noise measurement agree to within 1.0dB.
3.7 Results and Observations 3.7.1 Baseline monitoring for noise impact was conducted from 9:30am of 30 January 2018 to 11:00am 13 February 2018. The baseline noise levels at Noise Monitoring Stations at SKC (i.e. M1/ N_S1 to M3/ N_S3) are summarized in Table 3.4. Details of noise monitoring results are presented in Appendix H. 3.7.2 No construction activity, major noise source and extreme weather which might affect the results were observed during the baseline monitoring. 3.7.3 Some data of Leq 30min exceeded 70 dB(A) in M2 and M3, where the major noise source was found to be activities of the treatment centre from their users, guard dogs and vehicles.Table 3.4 Summary of Baseline Noise Monitoring Results
|
Location |
Noise in dB(A) |
|||||||
|
AverageNOTE1 |
Range |
|||||||
|
Leq 30min Daytime (7:00-19:00 on normal weekdays) |
Leq 5min Daytime (7:00-19:00 on Sunday and general holidays) |
Leq 5min Evening time (19:00-23:00) |
Leq 5min Night time (23:00-07:00) |
Leq 30min Daytime (7:00-19:00 on normal weekdays) |
Leq 5min Daytime (7:00-19:00 on Sunday and general holidays) |
Leq 5min Evening time (19:00-23:00) |
Leq 5min Night time (23:00-07:00) |
|
|
M1/ N_S1 |
49.7 |
48.6 |
45.4 |
44.6 |
41.3-64.7 |
42.9-55.6 |
40.8-53.0 |
38.7-53.1 |
|
M2/ N_S2 |
61.9 |
61.9 |
53.2 |
48.8 |
41.5-74.6 |
41.5-72.0 |
44.9-65.3 |
40.0-60.9 |
|
M3/ N_S3 |
57.5 |
52.0 |
52.7 |
47.1 |
41.1-73.0 |
42.2-60.2 |
40.5-64.9 |
33.0-61.7 |
NOTE 1: The calculated logarithm average of all Leq 5min from field measurement during the baseline period
3.8 Action and Limit Levels 3.8.1 The Action/Limit Levels in line with the criteria of Practice Note for Professional Persons (ProPECC PN 2/93) Noise from Construction Activities Non-statutory Controls and Technical Memorandum on Environmental Impact Assessment Process issued by HKSAR Environmental Protection Department [EPD] under the Environmental Impact Assessment Ordinance, Cap 499, S.16 are presented in Table 3.5.Table 3.5 Action and Limit Levels for Noise
|
Time Period |
Action Level |
Limit Level (dB(A)) |
|
0700-1900 hrs on normal weekdays |
When one documented complaint is received |
75 dB(A) |
4 ECOLOGY 4.1 Marine Mammal There were three parts of baseline marine mammal monitoring conducted prior to the commencement of works and agreed with AFCD, namely the Vessel-based Line-transect Survey, Passive Acoustic Monitoring and Land-based Theodolite Tracking, which were carried out between 30 January 2018 and 14 May 2018.
In total, 56 groups of finless porpoise, numbering 148 individuals, and only two groups of two Chinese White Dolphins were observed in Southeast Lantau waters during the three-month Vessel-based Line-transect Survey as detailed in Appendix I.
Major findings along and near the site of IWMF (collectively called the Site below) are summarized as follows:
· Several grids had moderately high to high porpoise densities near the Site
· Porpoise densities were the highest at the IWMF project area near Shek Kwu Chau
· The porpoise density was close to zero along the high-speed ferry route
The two Chinese White Dolphins sighting during the IWMF baseline monitoring surveys were identified as NL306 and WL69 by the photo-identification method. Both individuals have been sighted in Southeast Lantau waters in the past during AFCD long-term marine mammal monitoring.
The baseline marine mammal monitoring were conducted as shown in Table 4.1 and the location of surveys are shown in Figure 4.1 to 4.3.Table 4.1 Date of Baseline Marine Mammal Monitoring
|
No. |
Date |
Location |
|
Vessel-based Line-transect Survey |
||
|
1 |
15/02/2018 |
Southeast Lantau Survey Area |
|
2 |
20/02/2018 |
Southeast Lantau Survey Area |
|
3 |
05/03/2018 |
Southeast Lantau Survey Area |
|
4 |
19/03/2018 |
Southeast Lantau Survey Area |
|
5 |
03/04/2018 |
Southeast Lantau Survey Area |
|
6 |
09/04/2018 |
Southeast Lantau Survey Area |
|
Passive Acoustic Monitoring |
||
|
1 |
09/02/2018 13/03/2018 |
Shek Kwu Chau |
|
2 |
09/02/2018 13/03/2018 |
Tai A Chau |
|
3 |
13/03/2018 17/04/2018 |
Pui O Wan |
|
Land-based Theodolite Tracking |
||
|
1 |
30/01/2018 |
Shek Kwu Chau |
|
2 |
02/02/2018 |
Shek Kwu Chau |
|
3 |
06/02/2018 |
Shek Kwu Chau |
|
4 |
07/02/2018 |
Shek Kwu Chau |
|
5 |
13/02/2018 |
Shek Kwu Chau |
|
6 |
14/02/2018 |
Shek Kwu Chau |
|
7 |
21/02/2018 |
Shek Kwu Chau |
|
8 |
23/02/2018 |
Shek Kwu Chau |
|
9 |
27/02/2018 |
Shek Kwu Chau |
|
10 |
28/02/2018 |
Shek Kwu Chau |
|
11 |
01/03/2018 |
Shek Kwu Chau |
|
12 |
09/03/2018 |
Shek Kwu Chau |
|
13 |
13/03/2018 |
Shek Kwu Chau |
|
14 |
14/03/2018 |
Shek Kwu Chau |
|
15 |
15/03/2018 |
Shek Kwu Chau |
|
16 |
21/03/2018 |
Shek Kwu Chau |
|
17 |
22/03/2018 |
Shek Kwu Chau |
|
18 |
28/03/2018 |
Shek Kwu Chau |
|
19 |
29/03/2018 |
Shek Kwu Chau |
|
20 |
11/04/2018 |
Shek Kwu Chau |
|
21 |
13/04/2018 |
Shek Kwu Chau |
|
22 |
18/04/2018 |
Shek Kwu Chau |
|
23 |
20/04/2018 |
Shek Kwu Chau |
|
24 |
25/04/2018 |
Shek Kwu Chau |
|
25 |
27/04/2018 |
Shek Kwu Chau |
|
26 |
30/04/2018 |
Shek Kwu Chau |
|
27 |
02/05/2018 |
Shek Kwu Chau |
|
28 |
03/05/2018 |
Shek Kwu Chau |
|
29 |
11/05/2018 |
Shek Kwu Chau |
|
30 |
14/05/2018 |
Shek Kwu Chau |
|
|
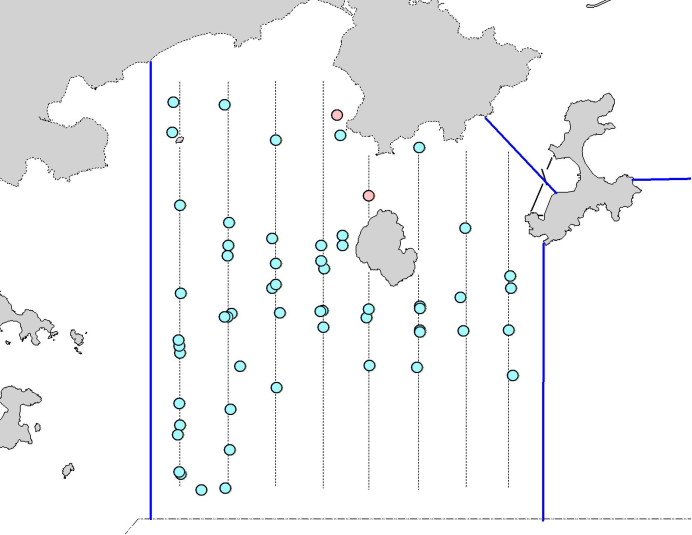
Figure 4.1 Line Transects for Marine Mammal Surveys |
|
|
Figure 4.2 Locations of Passive Acoustic Monitoring |
|
|
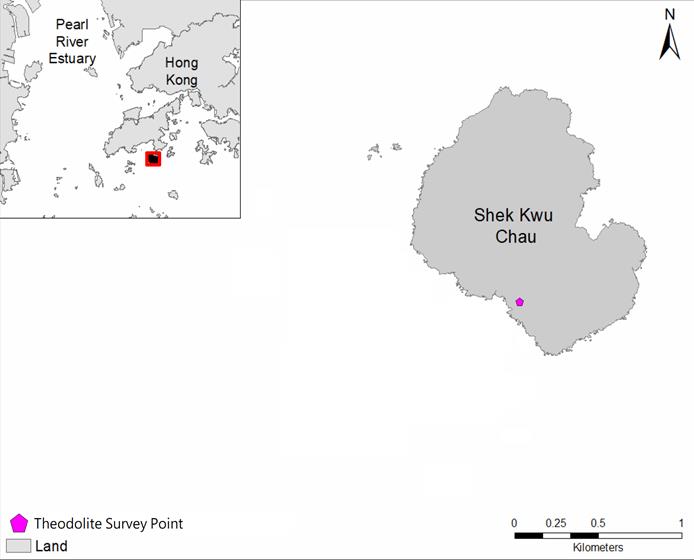
Figure 4.3 Location of Land-based Theodolite Tracking |
The below Section 4.1.1 to 4.1.3 has summarized the survey methodologies and major findings of the Vessel-based Line-transect Survey, Passive Acoustic Monitoring and Land-based Theodolite Tracking respectively.
4.1.1 Vessel-based Line-transect Survey
4.1.1.1 Monitoring Requirements
To determine the baseline conditions in distribution and occurrence of marine mammals in the study area before construction.
The pre-construction monitoring (i.e. baseline survey before construction) was conducted twice a month for the duration of three months within the peak season for Finless Porpoise occurrence (i.e. December 2017 to May 2018).
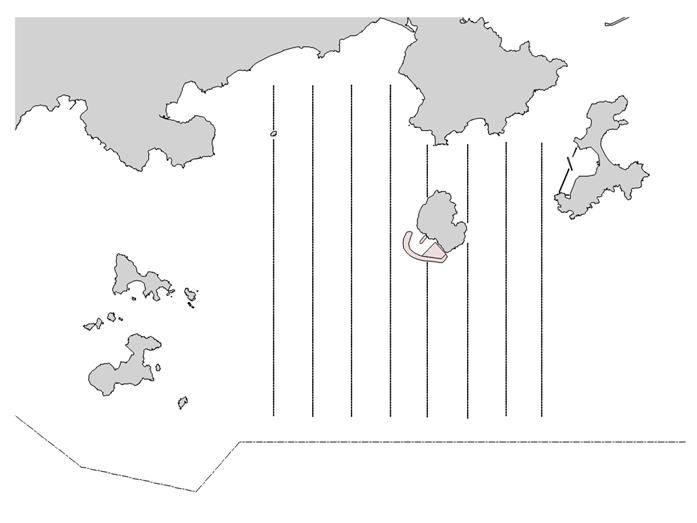
Eight transect lines were set at Southeast Lantau survey area, including Shek Kwu Chau, waters between Shek Kwu Chau and the Soko Islands, inshore waters of Lantau Island (e.g. Pui O Wan) as well as southwest corner of Cheung Chau.
4.1.1.4 Baseline Monitoring Methodology
For the vessel-based marine mammal surveys, the monitoring team adopted the standard line-transect method (Buckland et al. 2001), and followed the same technique of data collection that has been adopted over the last 20 years of marine mammal monitoring surveys in Hong Kong developed by Hong Kong Cetacean Research Project (HKCRP). The collected survey data has then been compatible with the long-term marine mammal monitoring programme commissioned by AFCD to allow potential comparisons and pooling data for various analyses.
For each vessel survey, a 15-m inboard vessel with an open upper deck (about 4.5 m above water surface) was used to make observations from the flying bridge area. Two experienced marine mammal observers (a data recorder and a primary observer) made up the on-effort survey team, and the survey vessel transited different transect lines at a constant speed of 13-15 km per hour.
The data recorder searched with unaided eyes and filled out the datasheets, while the primary observer searched for dolphins and porpoises continuously through 7 x 50 marine binoculars. Both observers searched the sea ahead of the vessel, between 270o and 90o (in relation to the bow, which is defined as 0o). Two additional experienced observers were available on the boat to work in shift (i.e. rotate every 30 minutes) in order to minimize fatigue of the survey team members. All observers were experienced in small cetacean survey techniques and identifying local cetacean species with extensive training by the Director of HKCRP.
During on-effort survey periods, the survey team recorded effort data including time, position (latitude and longitude), weather conditions (Beaufort sea state and visibility), and distance traveled in each series (a continuous period of search effort) with the assistance of a handheld GPS (Garmin eTrex Legend). Data including time, position and vessel speed were also automatically and continuously logged by handheld GPS throughout the entire survey for subsequent review.
When porpoises or dolphins were sighted, the survey team has end the survey effort, and immediately record the initial sighting distance and angle of the porpoise or dolphin group from the survey vessel, as well as the sighting time and position. Then the research vessel was diverted from its course to approach the animals for species identification, group size estimation, assessment of group composition, behavioural observations, and collection of identification photos (feasible only for Chinese White Dolphin). The perpendicular distance (PSD) of the porpoise or dolphin group to the transect line was later calculated from the initial sighting distance and angle, which has been used in the line-transect analysis for density and abundance estimation.
Distribution Pattern Analysis
The line-transect survey data was integrated with a Geographic Information System (GIS) to visualize and interpret different spatial and temporal patterns of porpoise and dolphin distribution using their sighting positions collected from vessel surveys. Location data of porpoise and dolphin groups were plotted on map layers of Hong Kong using a desktop GIS (ArcView© 3.1) to examine their distribution patterns in details.
Since the line-transect survey effort was uneven among different survey areas and across different months of the study period, the encounter rates of finless porpoises (number of on-effort sightings per 100 km of survey effort, and total number of porpoises sighted on-effort per 100 km of survey effort) were calculated in each survey area in relation to the amount of survey effort conducted. The encounter rate could be used as an indicator to determine areas or time periods of importance to porpoises within the study area. For encounter rate analysis of finless porpoises, only survey data collected under Beaufort 2 or below condition would be used for encounter rate analysis.
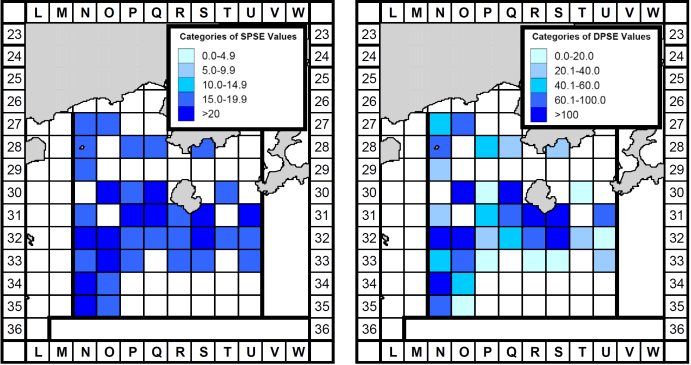
Quantitative Grid Analysis on Habitat Use
To take into account of the variations of survey effort across different sections within survey area, the quantitative grid analysis of habitat use (Hung 2008) was conducted to examine finless porpoise usage among 1-km2 grids within the Southeast Lantau survey area. For the grid analysis, SPSE (sighting density) and DPSE (porpoise density) values were deduced for evaluation on level of porpoise usage. First, positions of on-effort porpoise sightings from the study period were plotted onto 68 grids (1 km x 1 km each) within the survey area.
Sighting density grids and porpoise density grids were then normalized with the amount of survey effort conducted within each grid. The total amount of survey effort spent on each grid was calculated by examining the survey coverage on each line-transect survey to determine how many times the grid had been surveyed during study period. With the amount of survey effort calculated for each grid, the sighting density and porpoise density of each grid were further normalized (i.e. divided by the unit of survey effort).
The newly-derived unit for sighting density was termed SPSE, representing the number of on-effort sightings per 100 units of survey effort. In addition, the derived unit for actual porpoise density was termed DPSE, representing the number of dolphins/porpoise per 100 units of survey effort. Among the 1-km2 grids that were partially covered by land, the percentage of sea area was calculated using GIS tools, and their SPSE and DPSE values were adjusted accordingly.
The following formulae were used to estimate SPSE and DPSE in each 1-km2 grid within the study area:
SPSE = ((S / E) x 100) / SA%
DPSE = ((D / E) x 100) / SA%
where S = total number of on-effort sightings
D = total number of dolphins/porpoises from on-effort sightings
E = total number of units of survey effort
SA% = percentage of sea area
4.1.1.5 Results and Observations
Survey Effort and Marine Mammal Sightings
During the three-month IWMF EM&A baseline monitoring programme, a total of six sets of surveys were completed in Southeast Lantau survey between February and April 2018.
A total of 421.10 km of survey effort was collected from the line-transect surveys. The total survey effort conducted on primary and secondary lines were 359.17 km and 61.93 km respectively.
Notably, 87.5% of the total survey effort was conducted under favourable weather conditions (i.e. Beaufort Sea State 2 or below with good visibility) throughout the three-month study period, and the survey data collected in such condition can be used for encounter rate analysis for finless porpoises as summarized below at Table 4.2:
Table 4.2 IWMF EM&A Survey Effort Database (February-April 2018)
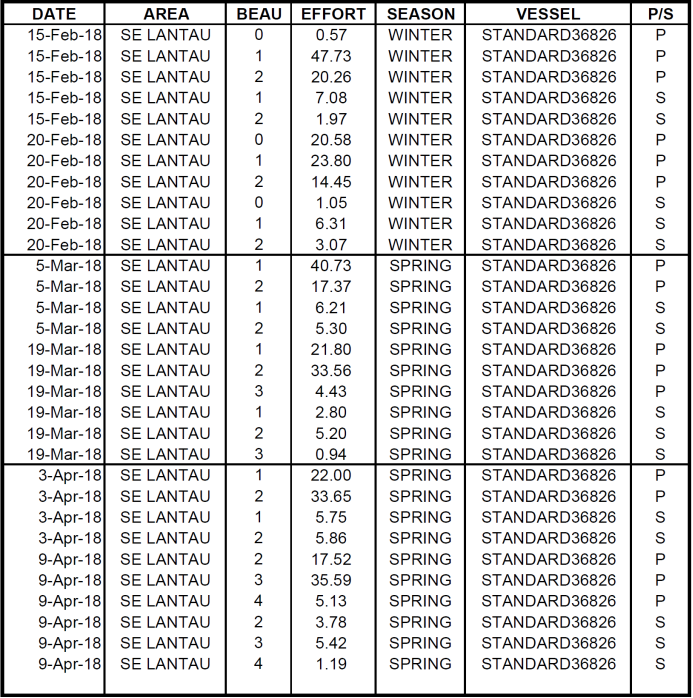
(Abbreviations: BEAU = Beaufort Sea State; P = Primary Line Effort; S = Secondary Line Effort)
During the three-month baseline monitoring period, a total of 56 groups of 148 finless porpoises and only two groups of two Chinese White Dolphins were sighted in Southeast Lantau waters (as listed at Table 4.3). All except three groups of porpoises and both dolphin groups were sighted during on-effort search, which can be utilized for encounter rate analysis and habitat use analysis.
Table 4.3 IWMF EM&A Finless Porpoise Sighting Database (February-April 2018)
(Abberviations: STG# = Sighting Number; HRD SZ = Porpoise Herd Size; BEAU = Beaufort Sea State; PSD = Perpendicular Sighting Distance; P/S: Sighting Made on Primary/Secondary Lines)
Distribution of Finless Porpoises and Chinese White Dolphins
From February to April 2018, the porpoises were sighted evenly throughout most of the Southeast Lantau survey area, with the exception of the southeastern portion of offshore waters where no porpoise was sighted. More porpoises apparently occurred to the eastern and southern sides of Shek Kwu Chau, and in the waters between Shek Kwu Chau and the Soko Islands. On the contrary, they were less frequently sighted in the inshore waters of Lantau Island (i.e. Pui O Wan) as well as between the waters between Cheung Chau and Shek Kwu Chau.
Even though the Chinese White Dolphins have been rarely sighted in Southeast Lantau survey area in the past (see Hung 2016, 2017), two dolphin sightings were made during the three-month IWMF baseline monitoring period, with the two lone dolphins located within Pui O Wan and to the north of Shek Kwu Chau respectively. Distributions of marine mammal spotted in the surveys have been shown in Figure 4.4.
|
|
Figure 4.4 Distribution of finless porpoises (light blue dots) and Chinese White Dolphins (pink dots) during IWMF baseline monitoring surveys in Southeast Lantau survey area (February-April 2018), with transect lines shown. |
Encounter rate of Finless Porpoises
As the occurrence of dolphins in Southeast Lantau waters was exceptionally low in the past and during the present baseline monitoring period, their encounter rate has not been calculated.
The porpoise encounter rates for the three-month baseline monitoring period were 13.3 sightings and 36.4 porpoises per 100 km of survey effort. These encounter rates would serve as the important baseline parameters for comparison with the monitoring results from impact phase and operational phase monitoring programme to examine changes in porpoise usage in Southeast Lantau survey area in relation to the IWMF construction works and operation.
Habitat Use Pattern of Finless Porpoises
During the baseline monitoring period from February to April 2018, the grids in Southeast Lantau survey area that recorded moderately high to high porpoise densities were located to the west, southwest and southeast of Shek Kwu Chau, toward the southwestern end of the survey area (i.e. the offshore waters between Shek Kwu Chau and the Soko Islands), as well as the central portion of Pui O Wan (Figure 4.5).
On the contrary, the porpoises appeared to have avoided the offshore waters in Southeast Lantau survey area (especially a few kilometres to the south of Shek Kwu Chau), to the northeast of Shek Kwu Chau, and around Chi Ma Wan Peninsula (Figure 4.5). The porpoise density was also close to zero along the high-speed ferry route to traverse through the waters between Cheung Chau, Chi Ma Wan Peninsula and Shek Kwu Chau, and extending toward Shui Hau Peninsula (Figure 4.5)
|
|
Figure 4.5 Density of finless porpoises with corrected survey effort per km2 in Southeast Lantau survey area during IWMF baseline monitoring period (February-April 2018) |
The porpoise densities were the highest at the IWMF project area near Shek Kwu Chau, where the importance of the waters near Shek Kwu Chau as porpoise habitat has been consistently highlighted in previous years of AFCD marine mammal monitoring.
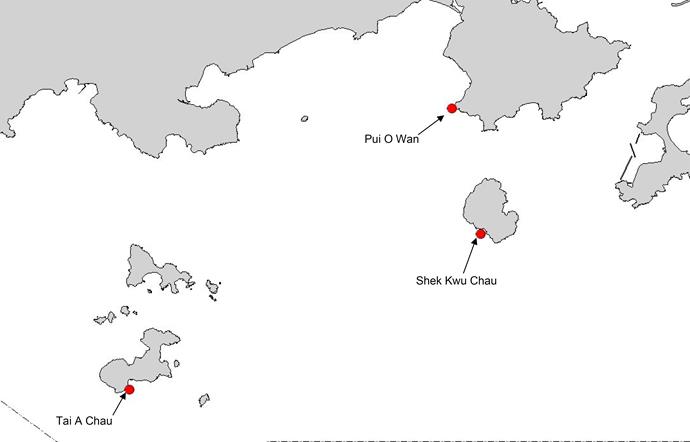
4.1.2 Passive Acoustic Monitoring
4.1.2.1 Monitoring Requirements
To study the baseline 24-hour activity pattern within and outside of the Project Area by marine mammals before construction.
Detectors were left on-site to carry out 24-hours monitoring for over 30-day monitoring period during the peak occurrence period of Finless Porpoise (December to May).
One porpoise detector was placed within the Project Area, while other two porpoise detectors were placed outside the Project Area as control sites. The locations of the two control sites (i.e. within Pui O Wan and to the south of Tai A Chau) were specifically chosen, as these control sites were regularly visited by the porpoises based on past AFCD long-term monitoring data, and were also confirmed by the professional team on the feasibility for deployment and retrieval of the C-POD units.
4.1.2.4 Baseline Monitoring Methodology
Underwater Passive Acoustic Monitoring Survey
According to the EM&A requirement, one automated static porpoise detectors should be placed within the Project Area, while another two porpoise detectors should be placed outside of the Project Area as control sites. These three detectors would then be left on-site to carry out 24-hour monitoring over the 30-day monitoring period during the peak season of porpoise occurrence.
For such underwater passive acoustic monitoring works, the project team selected the C-POD (developed by Chelonia Ltd.) as the device to record the 24-hour activity of finless porpoises (and Chinese White Dolphins to a lesser extent). A C-POD unit consists of an 80-cm long plastic pipe with a hydrophone at one end below which an electronic filter and amplifier are positioned. The hydrophone records all sounds omni-directionally within the frequency range of 20-160 kHz.
The C-POD can detect the presence of finless porpoise and Chinese White Dolphins by identifying the trains of echolocation sounds that they produce. It uses digital waveform characterization to select all clicks similar to cetacean clicks and logs the time, centre frequency, sound pressure level, duration and bandwidth of each click.
Three C-PODs were originally planned to be deployed by a professional dive team on the seabed within and in the vicinity of the IWMF site, as well as two control sites situated near Tai A Chau and Shek Kwu Chau for comparison. The two control sites were chosen due to their importance as porpoise habitats based on past monitoring study results. The C-PODs would be retrieved from the seabed by a professional dive team for servicing approximately every one to two months.
During each deployment, the C-POD unit serial numbers as well as the time and date of deployments were recorded. Information including the GPS positions and water depth at each of the deployment locations were also obtained.
When a C-POD unit was retrieved and refurbished (e.g. scratching off all attached barnacles on the unit surface), the lid would be opened, and the SD card with the C-POD data would then be removed from the unit for data download. Such data was then opened on the CPOD.exe software (also developed by Chelonia Ltd.) for further analyses by the professional data analyst Mr. Daniel Murphy, who is uniquely authorized to carry out C-POD analysis on behalf of Chelonia Limited. Mr. Murphy has worked closely with the developer of C-POD on the analysis of data from thousands of hours (over 400 years) of C-POD deployment.
To differentiate between the two resident cetacean species, the click trains of finless porpoises are characterized by their narrow band high frequency (NBHF) clicks that contain many cycles per click but are comparatively quiet compared with the Chinese White Dolphins.
On the contrary, the dolphins produce shorter clicks (i.e. less cycles per click) which are broadband across the detection range (unlike the clicks produced by porpoises which are very narrow band). Dolphins are also much louder than porpoises, and multi-path detections (when a single click bounces off the water surface or other reflecting object) are more likely for them.
For detailed data analyses, the raw click data on the C-POD was first converted by the CPOD.exe software to CP1 files. The click data was then processed using the KERNO classifier to identify click trains and their likely sources and reject weak boat sonar. The classified click trains were recorded in a CP3 file.
The integrity of data record was first checked, and the period of adequate deployment and correct operation were identified. Visual validation was then performed to assess the overall rate of false positive detection positive minutes (DPM) as identified by the KERNO classifier. This validation method was based on the characteristics of clicks, multi-path clusters, and trains. Additional criteria based on the characteristics of the ambient noise regime could also be used, particularly in relation to boat sonar and sediment transport noise, which could generate a large number of ultrasonic clicks.
Notably, the level of false positives is not some consistent fraction of true positives, but is determined by the prevalence of the sources that are liable to be misclassified as dolphin clicks, such as boat sonar and sediment transport noise. Moreover, it should be recognized that the cause of a substantial proportion of the false positive dolphins was actually true dolphins, but were rejected simply because they were not distinctive enough to meet the stringency of these criteria.
After the visual validations, the detection positive minutes (DPMs) could then be assessed as the parameter for porpoise and dolphin occurrences at each deployment location. The DPM was chosen to calculate the total number of minutes where at least one click train was detected within a one-minute period, in order to measure the amount of time porpoises or dolphins spend in an area.
Using DPM could eliminate the possibility of counting individual click trains produced by more than one dolphin or porpoise, as the number of animals detected is unknown. The DPM is also very useful for detecting diel and seasonal patterns of porpoise and dolphin occurrences in order to determine the level of habitat utilization by both species at the various deployment locations.
4.1.2.5 Results and Observations
Summary of data collection with overall occurrences of porpoises and dolphins
The summary of deployment data with detection statistics of finless porpoises shown in Table 4.4.
Table 4.4 Summary deployment data and statistics on detection of Indo-Pacific finless porposies for IWMF EM&A baseline monitoring study
(Note: "Days": number of logged days the CPOD was on and recording; "DPD% of days": detection positive days as a percentage of logged days; DPM: detection positive minutes, minutes where at least one porpoise train was detected; "Mins on": number of minutes the CPOD was on a logging data; % Time lost: percentage of time lost because the minute click limit has been reached and no data was recorded for that minute)
Originally, three C-POD units were planned to be deployed at three locations on February 9th and retrieved on March 13th. However, while the two units deployed at Shek Kwu Chau and Tai A Chau sites were successfully recovered on the March 13th, the C-POD unit deployed at Pui O Wan site was lost. As a replacement under the contingency plan, another C-POD unit was deployed on the same day (March 13th) at Pui O Wan, which was later recovered successfully on April 17th. Therefore, the EM&A requirement of at least 30 consecutive days of PAM data collection at the Project Area and two control sites has been fulfilled during the baseline monitoring period.
Among the three sites, the C-POD units were deployed for 32.11 days at Shek Kwu Chau, 32.05 days at Tai A Chau and 34.85 days at Pui O Wan.
All three units of C-POD have recorded good quality data during the study period. Porpoise activity was recorded on all days (100%) at both Shek Kwu Chau and Tai A Chau sites, while such activity was recorded on all but one day (97.3%) at Pui O Wan. Moreover, the activity level of finless porpoises was much higher at Tai A Chau (with mean DPM per day of 487.5) and Shek Kwu Chau (338.2), but was relatively lower at Pui O Wan (98.5).
On the contrary, very little true detection of Chinese White Dolphins were classified and all DPMs were visually validated, resulting in 8 DPMs at Shek Kwu Chau, 21 DPMs at Tai A Chau, and no true dolphin detections at Pui O Wan.
Evaluation of detection errors, loss of click detections and boat sonar
Visual validation was used to assess the overall rate of false positive porpoise DPM as identified by the KERNO classifier. Such false positives were found to be 0% (with 95% confidence level) at Shek Kwu Chau, 1% at Tai A Chau and 2% at Pui O Wan.
In total, only 3 DPMs over all files were found to be false during the inspection of porpoise DPM samples, and these were misclassified sediment transport noise.
Moreover, a small percentage of time was lost in Shek Kwu Chau (1%) and Tai A Chau (2%). On the contrary, most minutes at Pui O Wan were truncated, and on average 31.87% of time were lost from each minute at this site due to the minute click being reached before the end of the minute. Inspection of a sample of truncated minutes showed that sediment transport noise had caused the click limit to be reached before the end of the minutes, which is also the main cause for the higher percentage of loss of click detections.
Notably, boat sonar was detected throughout most of the deployment periods among the three sites. At Shek Kwu Chau and Pui O Wan, such noise was generally around 51 kHz, but at Tai A Chau, the 51kHz boat sonar noise was accompanied by a much stronger 76 kHz sonar which was classified correctly by the software.
Daily variations on occurrence of porpoises
Variations in porpoise activity per day were observed among all three sites. Porpoise activity in DPM is shown in Figure 4.6 to 4.8. At Shek Kwu Chau, porpoise activity remained fairly high throughout most of the deployment period, with distinct peaks on 11th February, 19th 21st February, 27th February and 8th March, with over 450 DPM per day on these dates.
However, it should be noted that even though porpoise activity remained at a high level with DPM over 150 per day from 10th February to 9th March, such level dropped sharply to a much lower level after 9th March, with 44 DPMs on 10th March, 92 DPMs on 11th, 8 DPMs on 12th and 4 DPMs on 13th.
It was noticed that the ground investigation works associated with IWMF construction commenced during the week of 9th March, such IWMF-related marine works could be a plausible cause for such unusual drop in porpoise activity toward the end of the PAM deployment period at Shek Kwu Chau, or there could also be other factor(s) that may have contributed the avoidance of Shek Kwu Chau since 9th March.
Porpoise activity level at Tai A Chau remained very high throughout the deployment period between 9th February and 13th March, with distinct peaks on 10th February, 19th February, 25th February, 28th February 5th March and 9th March, with over 600 DPM per day on these days (Figure 3). There was no noticeable drop off in porpoise activity level toward the end of the 32-day deployment period at Tai A Chau.
At Pui O Wan, there was only significant activity of porpoises during the first 13 days of the 35-day deployment period from March 14th to 26th (Figure 4). However, such activity level dropped noticeably since March 26th to a much lower level, mostly below 50 DPM per day for most days. As there was no complementary data (e.g. land-based observation data) available at this site, and the 35-day of deployment period was rather brief, the plausible factor(s) influencing such noticeable drop since late March could be not elucidated at this point.
|
|
Figure 4.6 Total Porpoise DPM per day at SHEK KWU CHAU Site from February 9th to March 13th, 2018 |
|
|
|
Figure 4.7 Total Porpoise DPM per day at TAI A CHAU Site from February 9th to March 13th, 2018 |
|
|
|
Figure 4.8 Total Porpoise DPM per day at PUI O WAN Site from March 13th to April 17th, 2018 |
Diel patterns on occurrences of porpoises
The diel patterns (i.e. 24-hour activity pattern) of finless porpoise occurrence among the three sites at Shek Kwu Chau, Tai A Chau and Pui O Wan are shown in Figures 4.9 to 4.11. Peaks and troughs were seen to occur at similar times at the different sites, with most DPMs detected in the middle of the night and early hours of the morning and minimum DPMs in the late morning to early afternoon.
In particular, Shek Kwu Chau showed the strongest peaks in porpoise activity level from 2am to 5am in the early morning, and the lowest activity level occurred around 4pm in the afternoon.
On the other hand, both Tai A Chau and Pui O Wan sites showed the strongest peaks in porpoise activities around midnight, while the minimum porpoise activity level at these sites occurred at around 9am and 11am respectively.
|
|
Figure 4.9 Porpoise DPM per hour of day at SHEK KWU CHAU Site from February 9th to March 13th, 2018 |
|
|
|
Figure 4.10 Porpoise DPM per hour of day at TAI A CHAU Site from February 9th to March 13th, 2018 |
|
|
|
Figure 4.11 Porpoise DPM per hour of day at PUI O WAN Site from March 13th to April 17th, 2018 |
4.1.3 Land-based Theodolite Tracking
4.1.3.1 Monitoring Requirements
To study the baseline movement and behavioral pattern of marine mammals within and near the Project Area before construction.
Thirty days of monitoring were planned during the peak months of porpoise occurrence (i.e. December to May) for the pre-construction phase. When adverse weather conditions (e.g. heavy rain or otherwise poor visibility less than 3km, or Beaufort Sea State 4 or above) were forecast, monitoring surveys would be postponed. Approximately six hours of tracking were conducted for each day of field work.
The present tracking study used the same station as in the AFCD monitoring study, which is situated at the southwest side of Shek Kwu Chau (GPS position: 22o11.47 N and 113o59.33 E). The station was selected based on its height above sea level (at least 20 metres), close proximity to shore, and relatively unobstructed views of the entire Project Area to the southwest of Shek Kwu Chau. The height of the Shek Kwu Chau Station established by the HKCRP team is 74.6 m high at mean low water, and only a few hundred metres to the IWMF reclamation site, which is ideal for the purpose for the present behavioural and movement monitoring of finless porpoises.
4.1.3.4 Baseline Monitoring Methodology
Shore-based Theodolite Tracking Methodology
On each survey day, monitoring team consisted of one experienced theodolite operator and at least two field observers for assistance. Observers searched systematically throughout the study area from the Shek Kwu Chau Station for finless porpoises using the unaided eye and 7 x 50 handheld binoculars. A theodolite tracking session was initiated when an individual or group of porpoises was located, and focal follow methods were adopted to track the porpoise movement.
Within a group, a focal individual was selected for the purposes of tracking the behaviour and movement of the group, based on its distinctive feature such as colouration or severe injury mark. The focal individual was then tracked continuously via the theodolite, with positions recorded whenever the porpoise surfaced. If an individual could not be positively distinguished from other members, the group would be tracked by recording positions based on a central point within the group when the porpoises surfaced.
Tracking would continue until animals were lost from view, moved beyond the range of reliable visibility (>5 km), or when environmental conditions obstructed visibility (e.g. intense haze, high sea state).
Behavioural state data were also recorded every 5 minutes for the focal individual or group. This interval was long enough to allow for determination of the behavioural state, and short enough to capture behavioural responses to nearby activities (e.g. transiting vessels). Moreover, when multiple groups or individuals were present in the study area, attempts would be made to record the behaviours of all groups or individuals every 10 minutes, with spotters assisting in determining behaviour of the porpoises.
Positions of porpoises and boat activities were measured using a Sokkisha DT5 digital theodolite with ± 5-sec precision and 30-power magnification connected to a laptop computer running the program Pythagoras Version 1.2 (Gailey, G. A. and Ortega-Ortiz, J. 2002. A note on a computer-based system for theodolite tracking of cetaceans. Journal of Cetacean Research and Management 4: 213-218). This program calculates a real-time conversion of horizontal and vertical angles collected by the theodolite into geographic positions of latitude and longitude each time a fix is initiated. Pythagoras also displays positions, movements, and distances in real-time. When possible, the position of the focal porpoise was recorded at every surfacing with use of Pythagoras.
Porpoise focal follow data were filtered to include only tracks with greater than 2 positional fixes and 10 minutes or greater in duration. In order to standardize data, each porpoise track was sub-sampled in 1-minute intervals and grouped into 10-minute segments. These standardised data were used to analyze group size, behaviour, and movement patterns. Porpoise response variables that were calculated for each 10-minute segment included mean swimming speed, reorientation rate, and linearity.
The diurnal pattern of porpoises observed off Shek Kwu Chau was calculated by dividing the total tracking time of all porpoise groups (prior to filtering for standardized segments as described above) by the total effort per hour block.
Data were tested for normality and transformed when residuals were not normally distributed.
4.1.3.5 Results and Observations
Summary of Theodolite Tracking Effort and Vessel Presence
A total of 179 hours and 59 minutes were spent during the 30 days of pre-construction phase tracking effort from January 30th through May 14th, 2018.
No Chinese White Dolphin was tracked from the Shek Kwu Chau station during the 30 days of monitoring, and therefore this species would not be further discussed for the rest of the report. On the other hand, finless porpoises were successfully tracked on 17 of 30 days of effort. In total, 95 porpoise groups were tracked for 20.07 hours as below Table 4.5 and Figure 4.12.
Table 4.5 Summary deployment data and statistics on detection of Indo-Pacific finless porposies for IWMF EM&A baseline monitoring study
|
|
|
Figure 4.12 Plots of first sightings of all porpoise groups (prior to filtering out standardised segments) obtained from land-based station at Shek Kwu Chau during baseline monitoring theodolite tracking surveys in 2018. |
After the raw data were filtered as described in the methodology section, 59 ten-minute standardized segments were extracted to analyze group size, movement patterns and behavioural states of finless porpoises. However, it should be cautioned that the data sample size for baseline evaluation on porpoise movement and behaviour was fairly small, as over 90% of the porpoise groups were sighted during the first 11 days of the 30-day study period, while very few of them were tracked since 9th March. This issue of a small sample size of theodolite tracking data collected from a relatively short period of time (mostly from 11 sessions between January 30th and March 1st in 2018) should be noted with caution when interpreting the movement and behavioural data of the finless porpoises in the study area.
A total of 543 vessels of 10 different types were observed and tracked within or in the proximity of the study area. They were categorized further into three main types and summarized in Table 4.6:
1) fishing boats (n=140), which included gill-netters, hand-liners,
purse-seiners and trawlers;
2) IWMF-related boats that were involved in the ground investigation works (n=112),
which included construction platforms, tug boats, transportation boats and construction
boats; and
3) other vessel types (n=286), which included container boats, speed boats,
government boats, research vessels and high-speed ferries.
Table 4.6 Summary deployment data and statistics on detection of Indo-Pacific finless porposies for IWMF EM&A baseline monitoring study
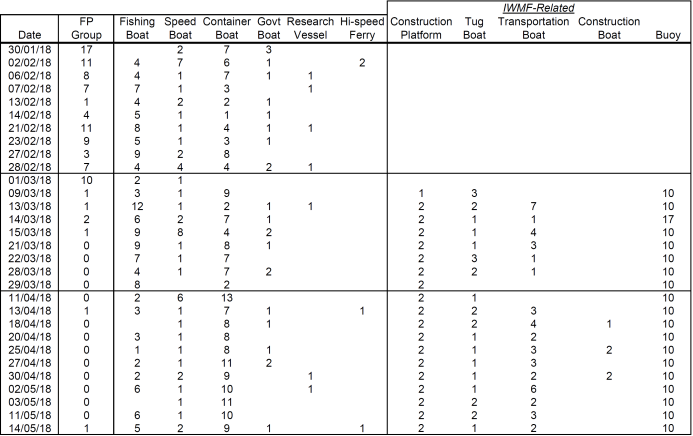
Among the different vessel types, the container boats were almost always traveling (>99% of observations), passing through the study area very briefly, moved further away from the area where most porpoise activities occurred. On the contrary, both fishing boats and speed boats had higher intensity of movements in the inshore waters of Shek Kwu Chau, which overlapped extensively with the main area of porpoise occurrence, but both types of boats also traveled frequently within a few kilometres from Shek Kwu Chau theodolite tracking station, with all the fixing showed below as Figure 4.13.
The daily number of porpoise groups that were observed and tracked from shore for each of the 30 tracking sessions was reviewed, during the first eleven tracking sessions between 30th January and 1st March, porpoises were frequently observed daily (with the exception of only one group being tracked on 13th February), and on four days more than ten groups were tracked.
However, since the tracking session conducted on 9th March 9th, or the 12th session of the study period, porpoise sightings dropped abruptly to nearly zero, with only 1-2 groups tracked from the 12th to 15th sessions (i.e. from March 9th to 15th), and another two groups tracked respectively on April 13th and May 14th. Moreover, the small number of porpoise groups tracked since March 9th were very elusive with only a few surfacings and difficult to be tracked, and were mainly located further away from the inshore waters of Shek Kwu Chau where the majority of the porpoise activities occurred during the first eleven sessions of theodolite tracking.
The IWMF-related boats (i.e. construction platforms, tug boats, transportation boats and construction boats) were mostly situated in the inshore waters of Shek Kwu Chau which overlapped extensively with the main area of porpoise occurrences as shown in Figure 4.13. In view of this finding, the drop of finless porpoise may plausibly due to increased no. of working platforms and vessel present in the survey area.
|
|
|
Figure 4.13 Plots of all fixed positions of finless porpoises and different boat types obtained from land-based station at Shek Kwu Chau during baseline monitoring theodolite tracking surveys in 2018. |
Occurrence of finless porpoises
The theodolite tracking effort was mostly conducted between the hours of 0900 and 1600, with sightings of porpoises relatively consistent across daylight hours. Porpoise sightings peaked at mid-day (within the 1100 and 1200 hour blocks) and again during the afternoon (1500 hour block). The highest percentage of porpoise group tracking time per hour of effort was during the 1200 hour block (15%) as presented in Figure 4.14, presenting the percentages of porpoises group tracking duration, per total effort time, based on time of day (prior to filtering out standardised segments). Time indicates the hour block during which porpoise groups were tracked. The "n" in parentheses represents the number of days that survey effort was carried out during the associated hour block.
|
|
|
Figure 4.14 Percentages of porpoises group tracking duration of Shek Kwu Chau |
Group sizes of finless porpoises
The mean group size of porpoises, based on standardised segments, was 4.65 ± 3.54 ranging from singles to a maximum group size of 20. Most of the porpoises that were tracked were in small groupings, either in single (17%) or dyads (17%), with sightings steadily decreasing as group size increased as below Figure 4.15.
|
|
|
Figure 4.15 Percentages of varying group sizes of porpoises of Shek Kwu Chau |
Notably, smaller groups were most often observed close to shore as shown in below Figure 4.16. However, this trend may reflect a sighting bias wherein single individuals may be more difficult to locate farther from the tracking station.
|
|
|
Figure 4.16 Plots of standardised porpoise group segments, based on group size, obtained from land-based station Shek Kwu Chau in 2018 |
Movement patterns of finless porpoises
Sample sizes were unequal and all response variables met assumptions of normal distribution except for linearity (Empirical Logit transformation was applied to approximate normal distribution). No issues with multicollinearity were detected. To identify autocorrelation, mixed-effect modelling was run using the lme function (package nlme) in program R, but the results showed no significant autocorrelation.
1) group size was associated with significantly higher swimming
speed, with speed generally increasing as group size increased. Milling
behaviour was associated with significantly slower swimming speed than traveling.
Time of day and boat presence had no significant effect on swimming speed;
2) foraging and milling behaviour were associated with significantly higher
reorientation rate than traveling. Boat presence was associated with
significantly reduced reorientation rate; and
3) milling behaviour was associated with significantly reduced linearity than
traveling. Boat presence had no significant effect on linearity.
In summary for the porpoise movement patterns, their swimming speed varied significantly based on natural factors, increasing with group size and decreasing in association with milling behaviour (compared to traveling behaviour).
Reorientation rate and linearity varied significantly based on behavioural state. Foraging and milling were associated with higher reorientation rate than traveling, and milling was associated with significantly reduced linearity than traveling. Reorientation rate was also significantly reduced in the presence of boats.
Behavioural states of finless porpoises
Observed porpoise behavioural states varied significantly from values expected by chance (Chi-square test, χ2=665.61, n=649 for 59 standardized tracks with 11 data points each, df=0, P<0.001).
Milling (67%, n=434) was observed more than expected by chance, and foraging (22%, n=143), traveling (10%, n=66) and socializing (1%, n=6) were observed less than expected by chance as shown on Figure 4.17 below.
|
|
|
Figure 4.17 Percentages of porpoise broad behavioural states recorded from Shek Kwu Chau, based on standardised segments |
4.1.4 Summary of Pre-construction Monitoring for Marine Mammal
Pre-construction Monitoring for Marine Mammal has been completed in accordance with the monitoring methodologies stated in the Updated EM&A Manual for the Project for verification of predicted impacts and effectiveness of the proposed mitigation measures in the future monitoring during construction and operational phases.
Notably that the amount of survey effort collected in baseline monitoring during the pre-construction period was fairly low, and therefore the habitat use pattern and findings derived from the three-month dataset should be treated with some caution.
4.2 White-bellied Sea Eagle 4.2.1 Monitoring Requirement
The main objective of the pre-construction monitoring is to verify the presence of WBSE in the Shek Kwu Chau area, as well as to confirm their breeding status and how the area is utilized by the potential breeding pair. For pre-construction phase, field surveys were conducted once per week for duration of three months during their breeding season (between December and May) immediately before the commencement of works. The monitoring frequency has been increased to daily during the first week of nestling period in order to collect information about their utilisation of the proposed construction site as a foraging ground.
4.2.2 Monitoring LocationSince there is no suitable land-based along the coast of SKC, only boat surveys were conducted. On Shek Kwu Chau Island, a nest of WBSE is located about 60 m above ground within a hillside shrubland habitat, 130 m in-land from shore, about 550 m away from the proposed reclaimed land, with no human access.
4.2.3 Monitoring MethodologyIn order to verify the presence of White-bellied Sea Eagles in Shek Kwu Chau area, boat surveys (8 m x 3.5 m work boat) was carried out before any construction work. Information collected include feeding, perching/roosing, preening, soaring, flying, nesting and territorial guarding and the time spent on each activity. Other disturbances such as anthropogenic activities, weather condition, or invasion by other fauna species will also be recorded.
Binocular, scope, camera, lens and GPS device used are summarized as Table 4.7 below:
Table 4.7 List of equipment will be used during Construction Phase Monitoring
|
Equipment |
Quantity |
|
Swarovski EL 8.5 x 42 Binocular |
1 |
|
Swarovski EL Range 8 x 42 Binocular |
1 |
|
Swarovski ATX 25-60 x 85 Spotting Scope |
1 |
|
Canon 1Dx Mark II Camera |
1 |
|
Canon EF300mm F2.8 Lens with Canon 2x Teleconverter |
1 |
|
Canon PowerShot G7X Camera |
1 |
|
Garmin GPSMAP 64S |
1 |
The weekly monitoring was started on 30 January 2018 (Table 4.8) to locate the nest and check if there is any chick inside the nest. After a few weeks survey, the WBSE nest was observed on 21 February 2018 and it is located at the western part of SKC island as shown in Figure 4.18.
The WBSE nest is quite away from the Shek Kwu Chau Treatment and Rehabilitation Centre. Any disturbances from anthropogenic activities on the island were not recorded during the monitoring period. However, fishing boat moving close the shore was occasionally recorded but not serious. Since the nest is about 160m away from the shore and it is not accessible, fishing boat activities didnt show any direct disturbance to the WBSE nest. Besides, the location of the nest is facing to the west, it was protected from strong winds such as winter and summer monsoons, therefore no obvious disturbance from bad weather was recorded during the monitoring period. No invasion of other fauna species was recorded as well. All GI works during the pre-construction monitoring did not show any affects to the WBSE adults and juveniles.
Table 4.8 Survey Schedule of WBSE Monitoring
|
Date |
Schedule |
Notes |
|
30/01/2018 |
Weekly Monitoring |
No nest record |
|
06/02/2018 |
Weekly Monitoring |
No nest record |
|
13/02/2018 |
Weekly Monitoring |
No nest record |
|
21/02/2018 |
Weekly Monitoring |
Nest located at the western part of SKC |
|
28/02/2018 |
Weekly Monitoring |
Suspected checks/juveniles were records inside the nest |
|
05/03/2018 |
Weekly Monitoring |
Confirmed chicks inside the nest |
|
06/03/2018 |
Daily Monitoring |
Started 7 days daily monitoring |
|
07/03/2018 |
Daily Monitoring |
Chicks fed by adults |
|
08/03/2018 |
Daily Monitoring |
Chicks stay inside the nest |
|
09/03/2018 |
Daily Monitoring |
Chicks stay inside the nest |
|
10/03/2018 |
Daily Monitoring |
Chicks stay inside the nest |
|
11/03/2018 |
Daily Monitoring |
Chicks fed by adults |
|
12/03/2018 |
Daily Monitoring |
Chicks fed by adults |
|
23/03/2018 |
Weekly Monitoring |
Juveniles left the net and stand on the tree branches |
|
29/03/2018 |
Weekly Monitoring |
Juveniles stayed inside the nest |
|
04/04/2018 |
Weekly Monitoring |
Juveniles stayed inside the nest |
|
09/04/2018 |
Weekly Monitoring |
Juveniles left the nest and stand on the tree branches |
|
17/04/2018 |
Weekly Monitoring |
Juveniles left the nest and stand on the tree branches |
|
24/04/2018 |
Weekly Monitoring |
Juveniles learning flight with adult |
|
02/05/2018 |
Weekly Monitoring |
Juveniles learning flight with adult |
|
11/05/2018 |
Weekly Monitoring |
Juveniles learning flight with adult |
|
15/05/2018 |
Weekly Monitoring |
Juveniles learning flight with adult |
|
|
Figure 4.18 Location of Nest of WBSE |
Present of chicks inside the nest was confirmed on 5 March 2018 survey and according to EM&A manual, a 10 weeks monitoring schedule was started on 6 March 2018 followed with a 7 days daily monitoring in first week. Both chicks and adults were record during the daily and weekly monitoring surveys. On 23 March 2018 survey, juveniles were recorded to leave the nest and stand on the tree branches next to the nest. On 24 Apr 2018 survey, juveniles were recorded to start learning flight around the nest area. The last survey has been conducted on 15 May 2018, juvenile were still kept learning flight with the adults. No abnormal behavior of the adults (such as abandoned of the nest and chicks) and chicks were recorded during the monitoring period.
The weather condition during the monitoring and photo records for the WBSE could be found in the detail survey report as Appendix J.
4.3 Coral 4.3.1 Pre-construction Coral Mapping Survey Pre-construction Coral Mapping Survey was carried out between 30 January 2018 and 22 February at the coastal area of SKC, where the survey result has been reported in the Coral Translocation Plan as attached in Appendix K. 4.3.2 Tagging and REA survey Tagging and REA survey of coral within site boundary and coastal area of Tai A Chau for pre-construction phase monitoring will be carried out within 2 weeks from the commencement of construction work as stated in the Coral Monitoring Plan, and be reported in the Baseline Report for Construction Phase Coral Monitoring.
5. CONCLUSION 5.1 Revision for Inclusion in the EM&A Documents 5.1.1 The baseline environmental monitoring was conducted according to the Updated EM&A Manual, Detailed Plan on Deep Cement Mixing and Proposal for Review Baseline Marine Water Quality for wet season for water quality, noise and ecology (Marine Mammal, WBSE and Coral Monitoring). 5.1.2 The monitoring methodology, parameters monitored, and monitoring locations are all in line with the Updated EM&A Manual for the Project, except for the in-situ wet bulb calibration for a DO meter was changed to be carried out before and after all measurements each day considering daily calibration is adequate for the type of DO meter employed. 5.1.3 Considering the baseline monitoring has not taken into account the seasonal variations for determination of Action and Limit Levels for WQM, criteria of Action and Limit Levels were changed as using the level deviated from the control stations SS, turbidity and salinity at the same tide of the same day of measurement whenever it is higher than the now-derived Action and Limit Levels. 5.1.4 With the agreement from Independent Environmental Checker (IEC), revision for inclusion will be made on the updated EM&A Manual in the coming revision and summarised as Table 5.1 below:
Table 5.1 Proposed Revisions for Inclusion in the EM&A Documents
5.2 Water Quality 5.2.1 Baseline marine water quality monitoring for dry season was conducted between 26 February and 26 March 2018, Baseline marine water quality monitoring for wet season was conducted between 13 August 2018 and 7 September 2018 and Baseline water quality monitoring for DCM was conducted from 24 May 2018 to 21 June 2018 at fourteen monitoring stations. All monitoring stations as specified in EM&A Manual were accessible and thus there is no revision for inclusion in the EM&A Manual. 5.2.2 No major pollution sources affecting the water quality background at the fourteen monitoring stations were observed. 5.2.3 Action and Limit Levels were derived based on the baseline monitoring results according to the EM&A Manual. 5.3 Noise 5.3.1 Baseline noise monitoring was carried out between 30 January 2018 and 13 February 2018 at three monitoring stations at Shek Kwu Chau. All monitoring stations as specified in EM&A Manual were accessible and thus there is no revision for inclusion in the EM&A Manual. 5.3.2 At all monitoring locations, the averaged baseline daytime noise monitoring results were well below the criteria of 75dB(A) for residential premises. No major noise sources affecting the noise background at the three monitoring stations were observed. 5.3.3 The Action Level of construction noise is based on documented valid complaints received, while the Limit Level for each monitoring location is set at a specific limit according to EIAO-TM and the EM&A Manual. 5.4 Ecology 5.4.1 Baseline marine mammal monitoring was conducted in the Southeast Lantau survey areas from January 2018 to May 2018. Finless porpoise and dolphin sightings, distribution, encounter rate, group size, habitat use, mother-calf pairs and behavior were reported in the marine mammal monitoring surveys baseline monitoring reports as Appendix I. Photo-identification and range estimation of identified individuals of encountered dolphin were also made. 5.4.2 Baseline white-bellied sea eagle monitoring was conducted from January 2018 to May 2018. The presence of White-bellied Sea Eagles in Shek Kwu Chau area was verified, along with Information include feeding, perching/roosting, preening, soaring, flying, nesting and territorial guarding and the time spent on each activity were collected in the full baseline monitoring report as Appendix J. 5.4.3 Pre-construction Coral Mapping Survey was carried out between 30 January 2018 and 22 February at the coastal area of SKC, where the survey result has been reported in the Coral Translocation Plan as Appendix K. Tagging and REA survey of coral within site boundary and coastal area of Tai A Chau for pre-construction phase monitoring will be carried out within 2 weeks from the commencement of construction work as stated in the Coral Monitoring Plan, and be reported in the Baseline Report for Construction Phase Coral Monitoring.